
In this tutorial we will use the CloudWatch datasource in Grafana to create dashboards on our CloudWatch Metrics in AWS.
What can we expect in this post
If you follow along, by the end of this tutorial you will be able to:
- Create IAM User so Grafana is able to read CloudWatch Metric data
- Create Dashboards of AWS Resources such as EC2, RDS, Lambda
- Create template variables so that you can filter on EC InstanceId, RDS Cluster Name, etc
Create IAM User
We will create a AWS IAM User, then we will associate AWS Managed Policies which will allow Read Only access on EC2 and CloudWatch.
The read-only access to CloudWatch will grant Grafana access to read metrics from CloudWatch.
We will filter on EC2 instances by Tag names, therefore we will require read-only access on EC2.
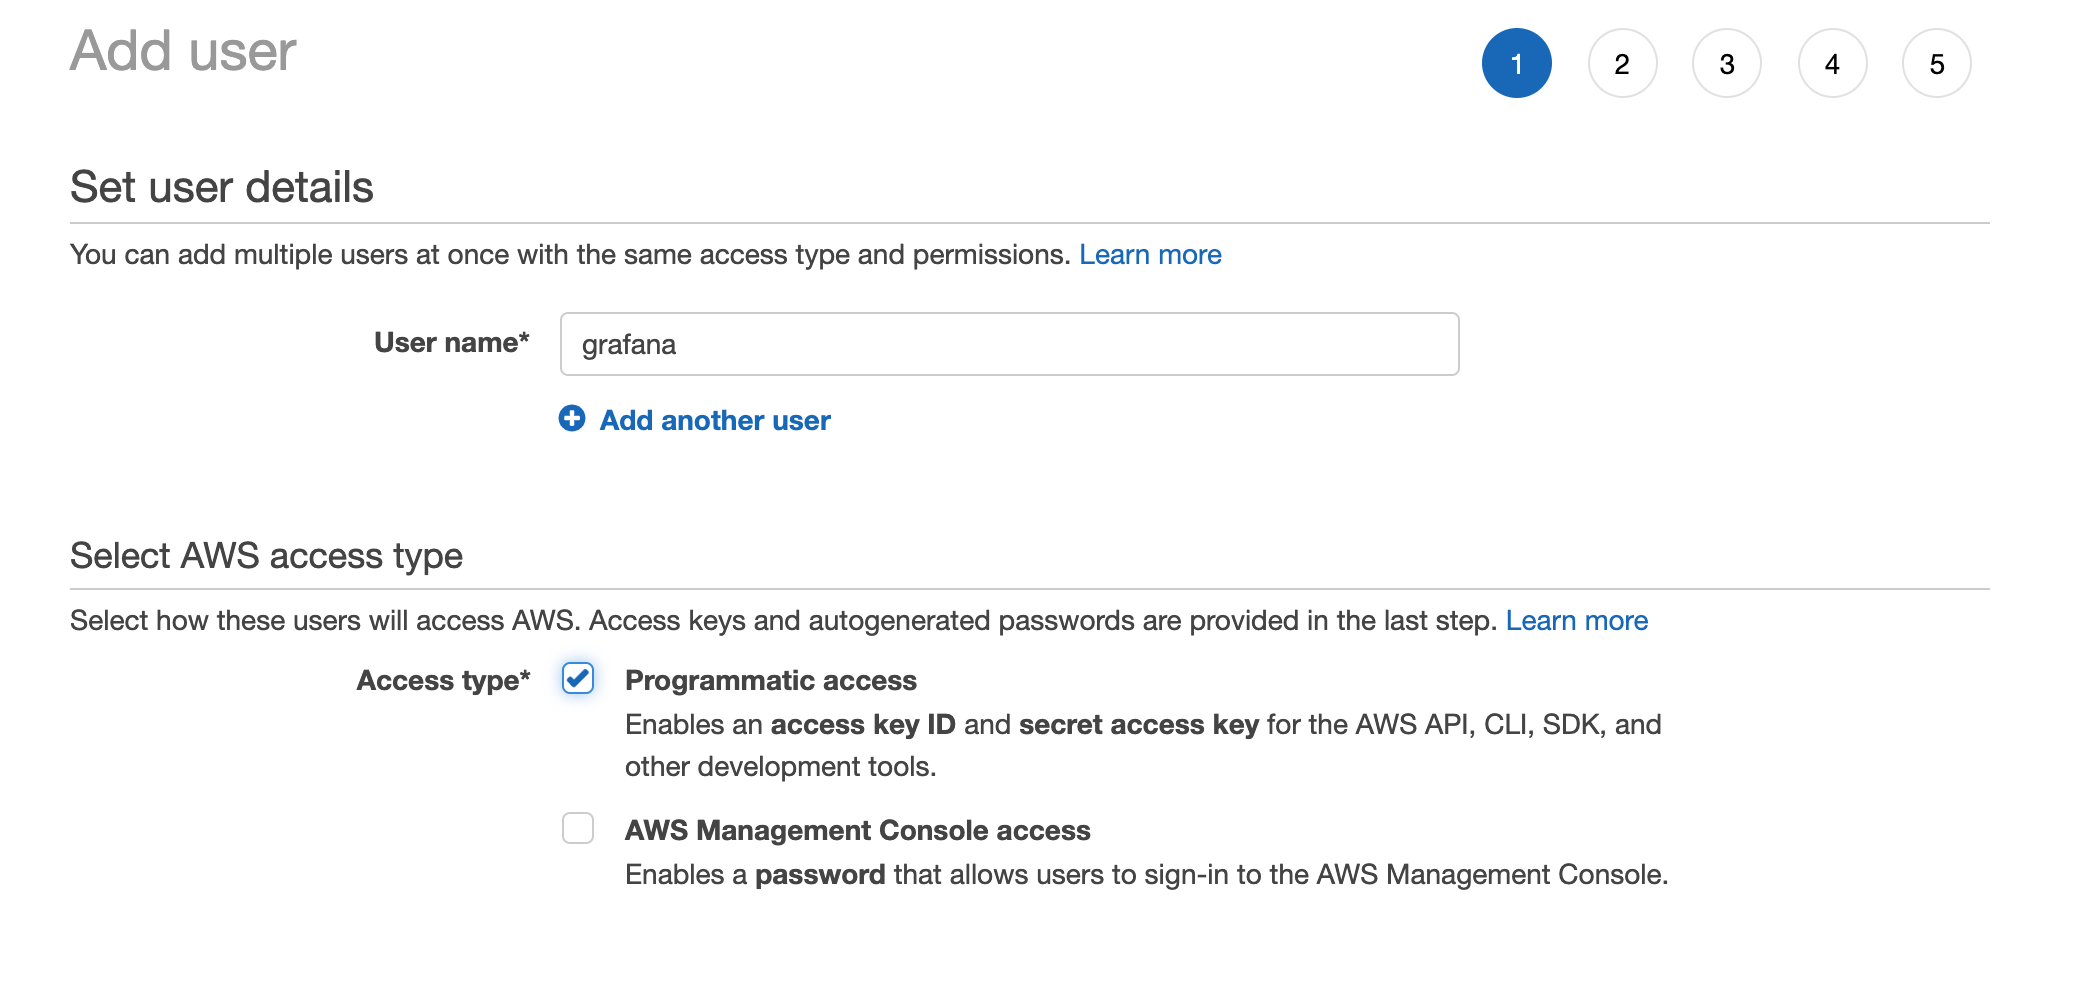
Head over to https://console.aws.amazon.com/iam/home and create a new IAM user, in my case I will call it grafana, and enable programmatic access as we will require aws access and secret keys:
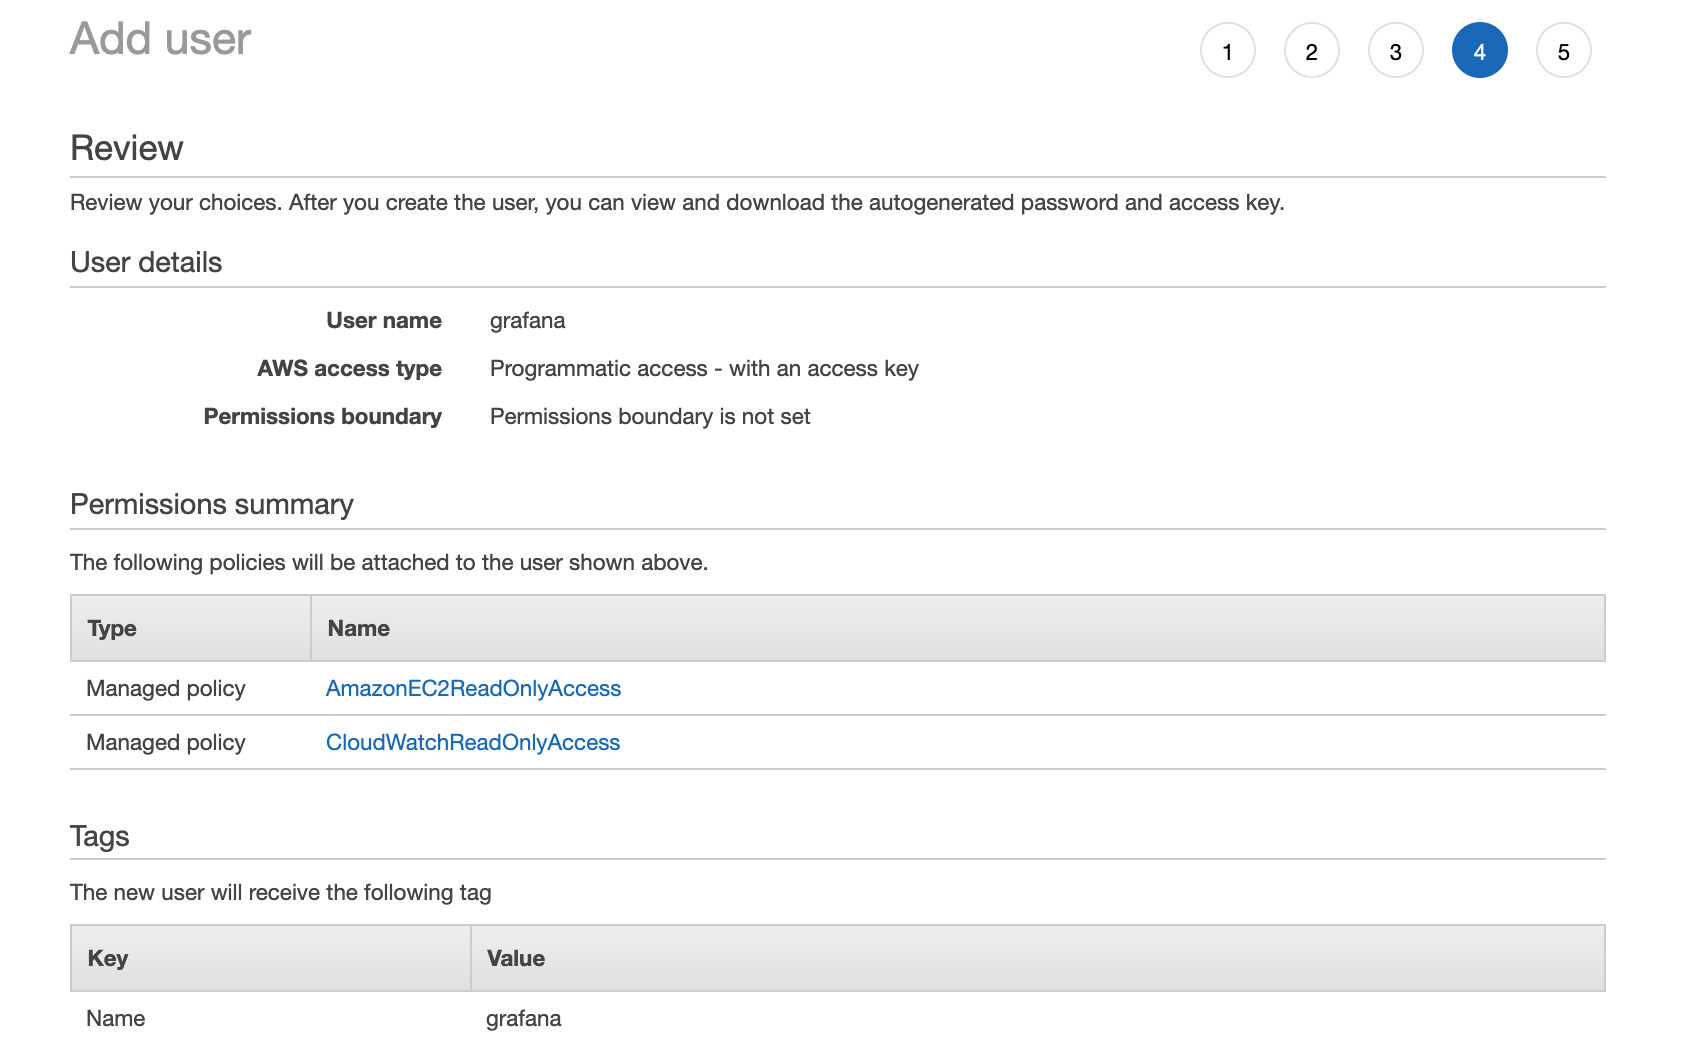
Next, select "Attach policies directly" and select:
- CloudWatchReadOnlyAccess
- AmazonEC2ReadOnlyAccess
Then go ahead and add any tags of your choice, then you should see a summary page more or less like this:
Once you select "Create user", make sure that you note down your AWS Access and Secret key as the secret key is not retrievable after you created the user.
Provision a Grafana Instance
If you want to install Grafana on a dedicated server, you can follow this post in order to get Grafana running.
But in this case I will be using Docker to get Grafana running for this demo. If you don't have docker installed, you can check their documentation to get docker installed.
Here is my docker-compose.yml:
version: '3'
services:
  grafana:
    image: grafana/grafana
    container_name: grafana
    networks:
      - grafana
    environment:
      - GF_PATHS_DATA=/var/lib/grafana
    ports:
      - 3000:3000
    volumes:
      - ./data:/var/lib/grafana

networks:
  grafana: {}
Once that is done, deploy grafana:
$ docker-compose -f docker-compose.yml up
..
grafana    | t=2020-03-29T15:30:17+0000 lvl=info msg="HTTP Server Listen" logger=http.server address=[::]:3000 protocol=http subUrl= socket=
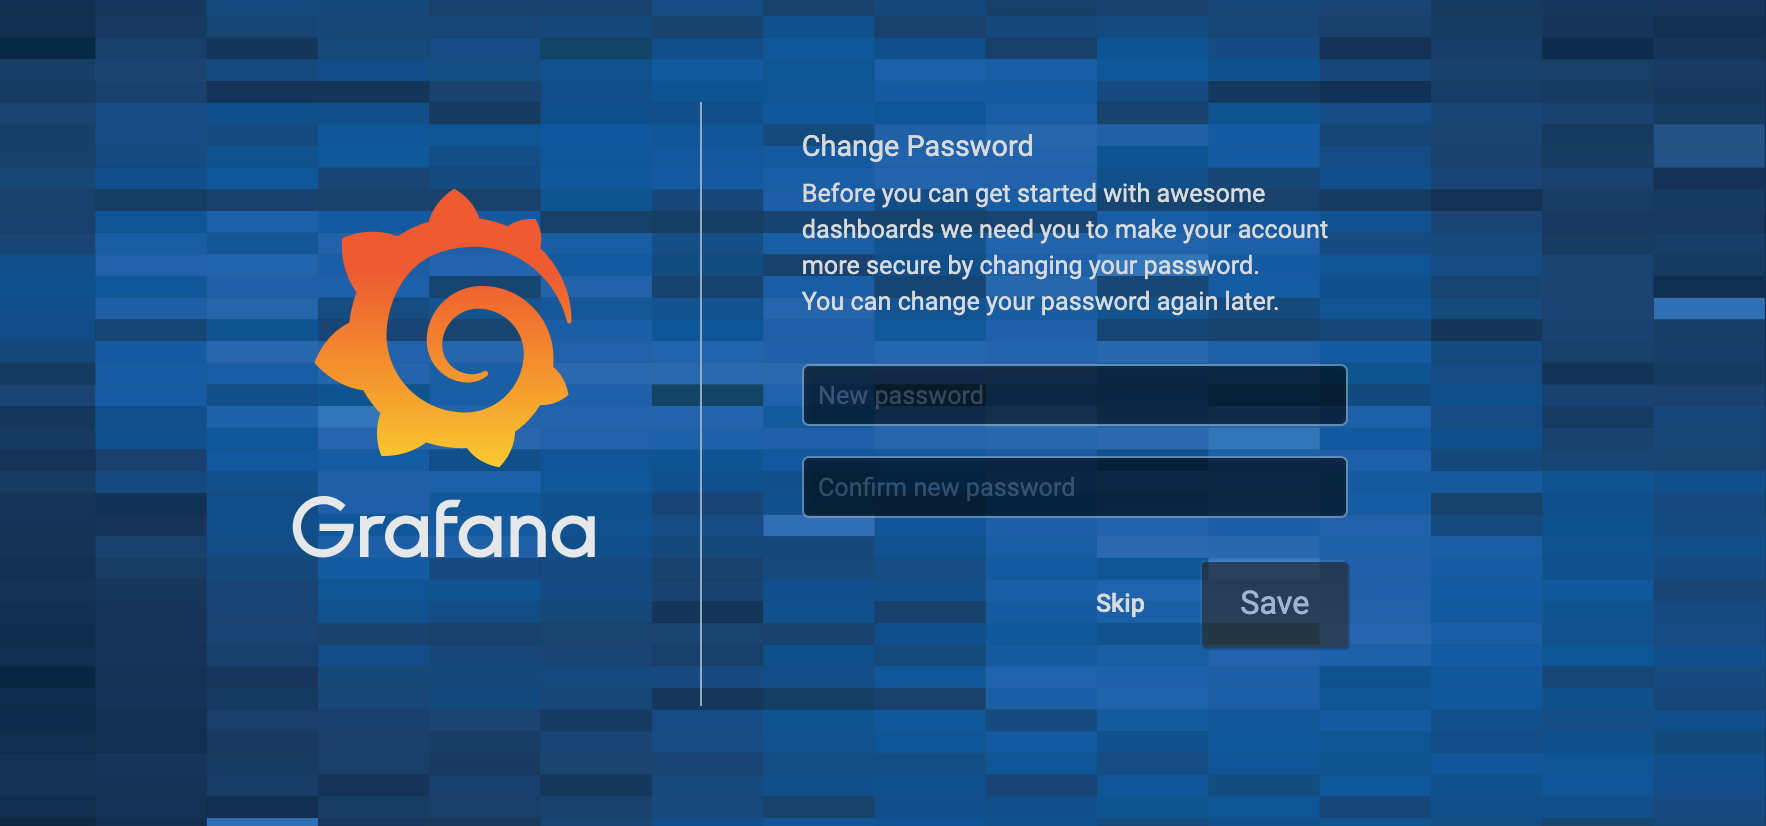
Once Grafana is deployed you can access Grafana on http://localhost:3000 with the default username admin and password admin. It will ask you to change your password.
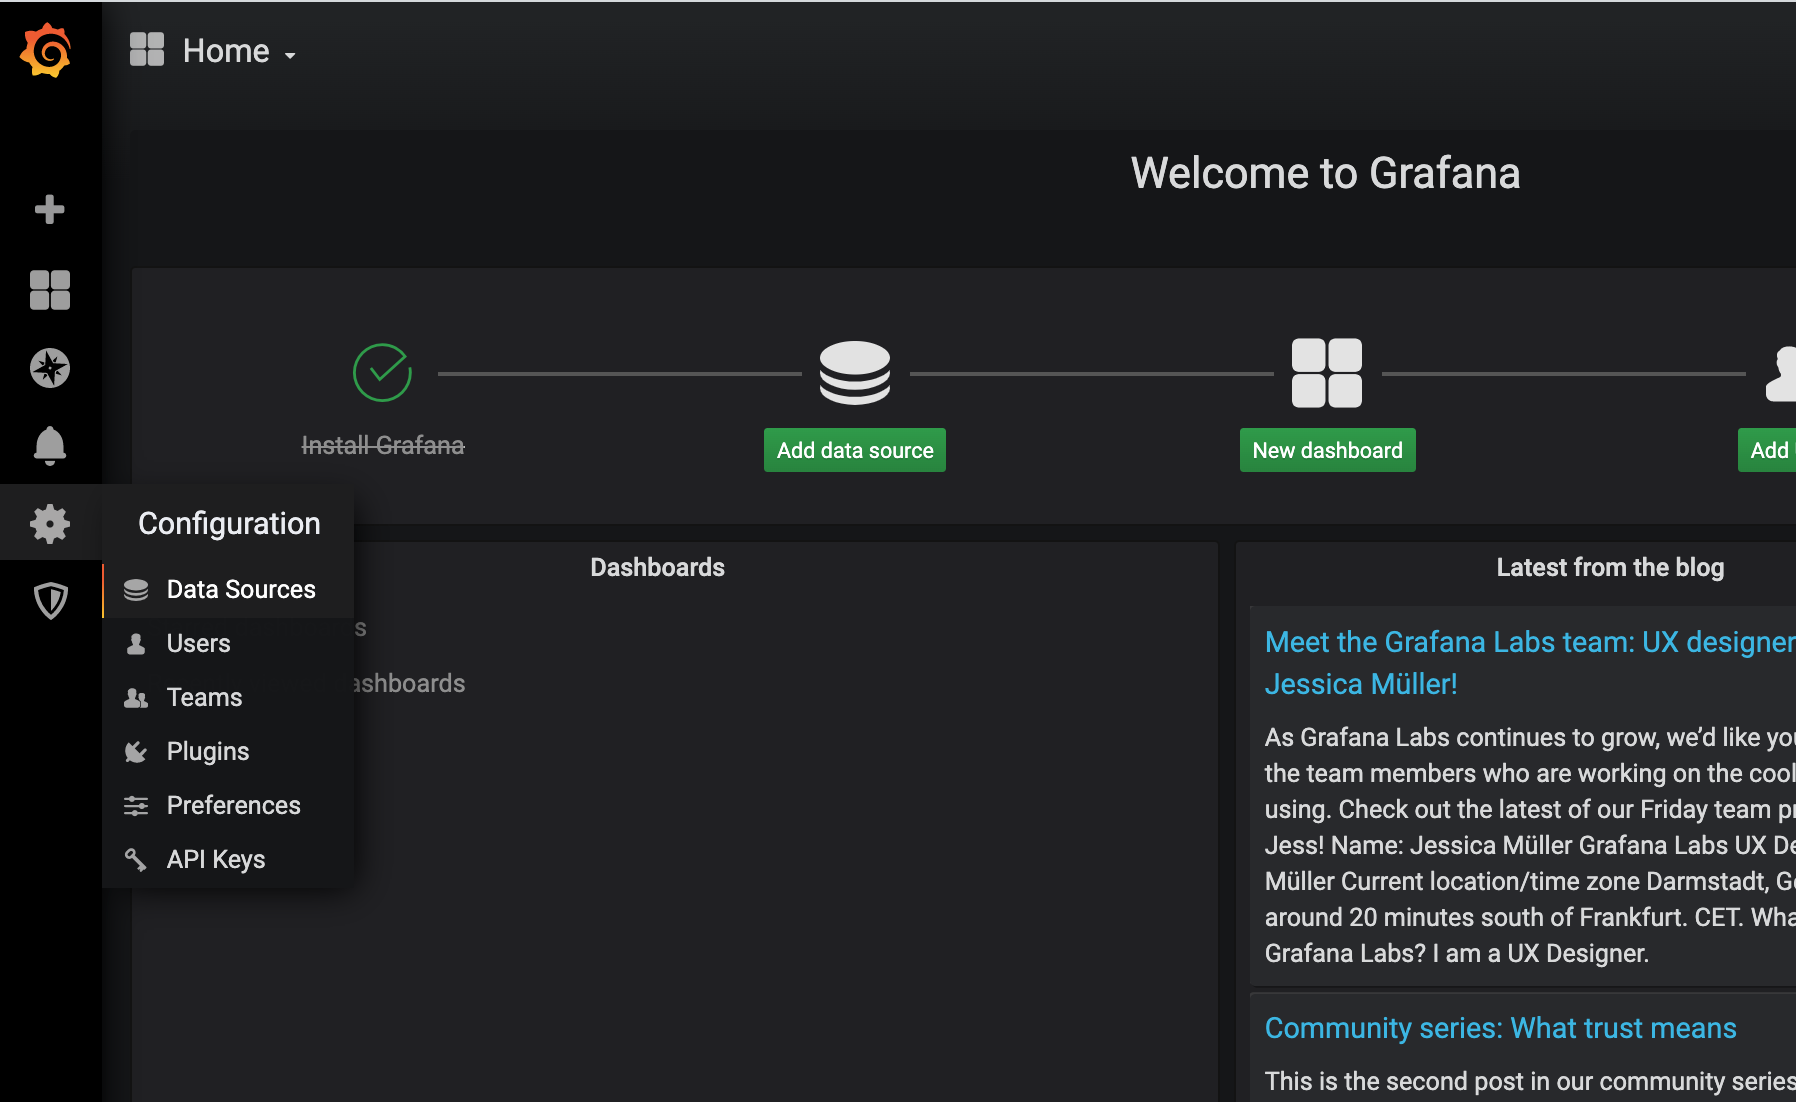
Once you changed your password, from the left select the gear icon and select Data Sources:
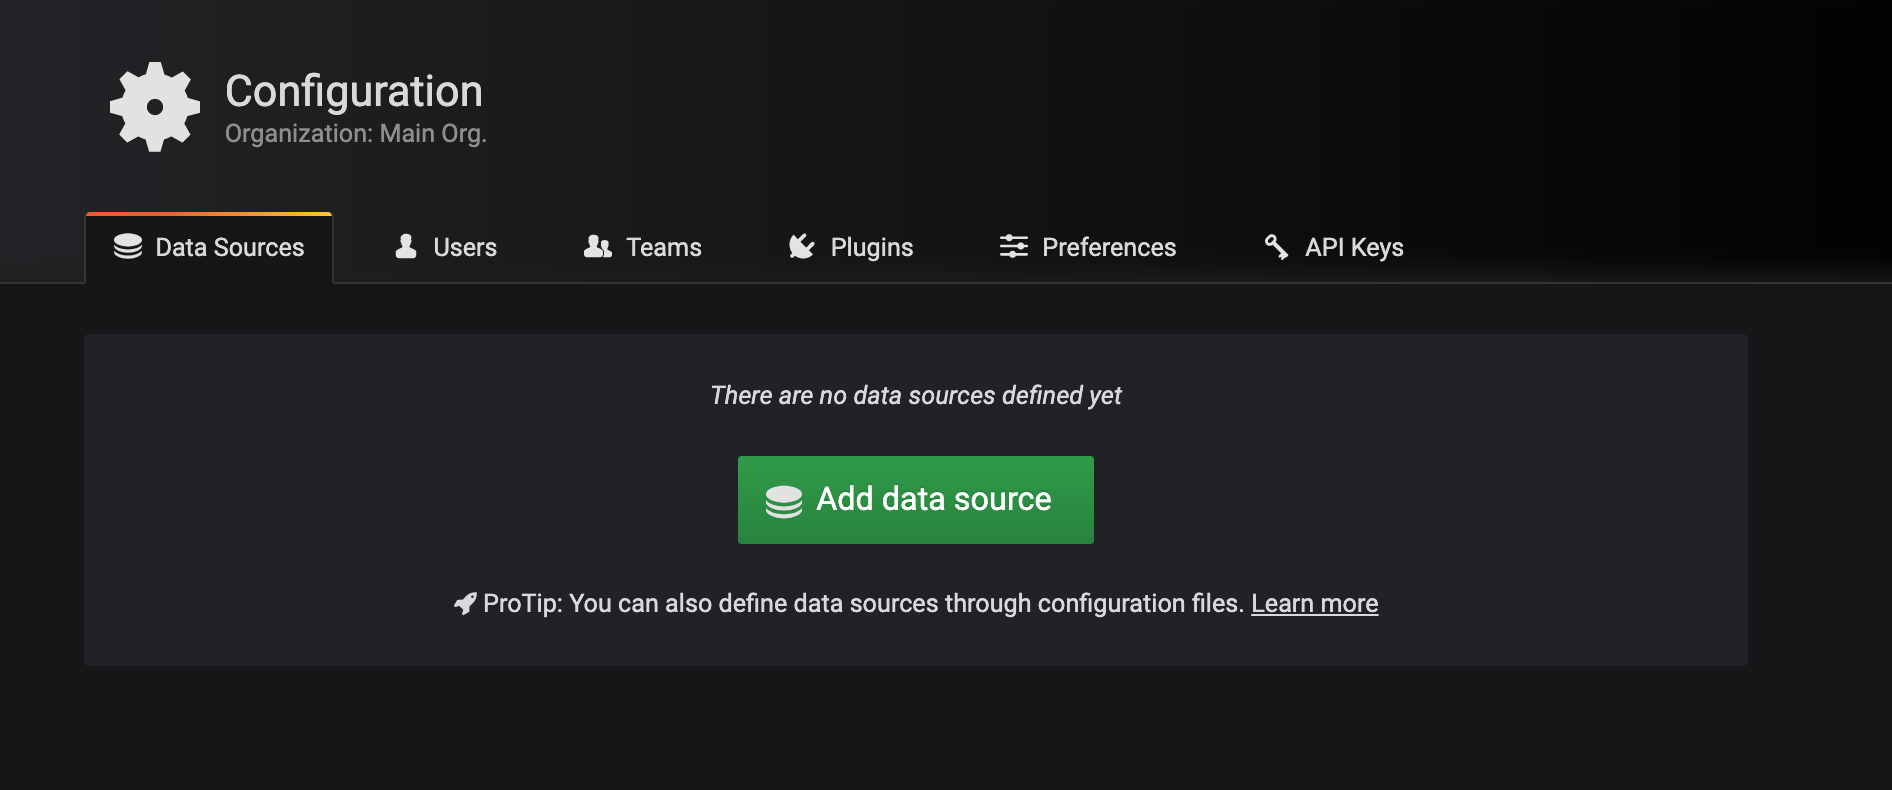
Then select add a data source:
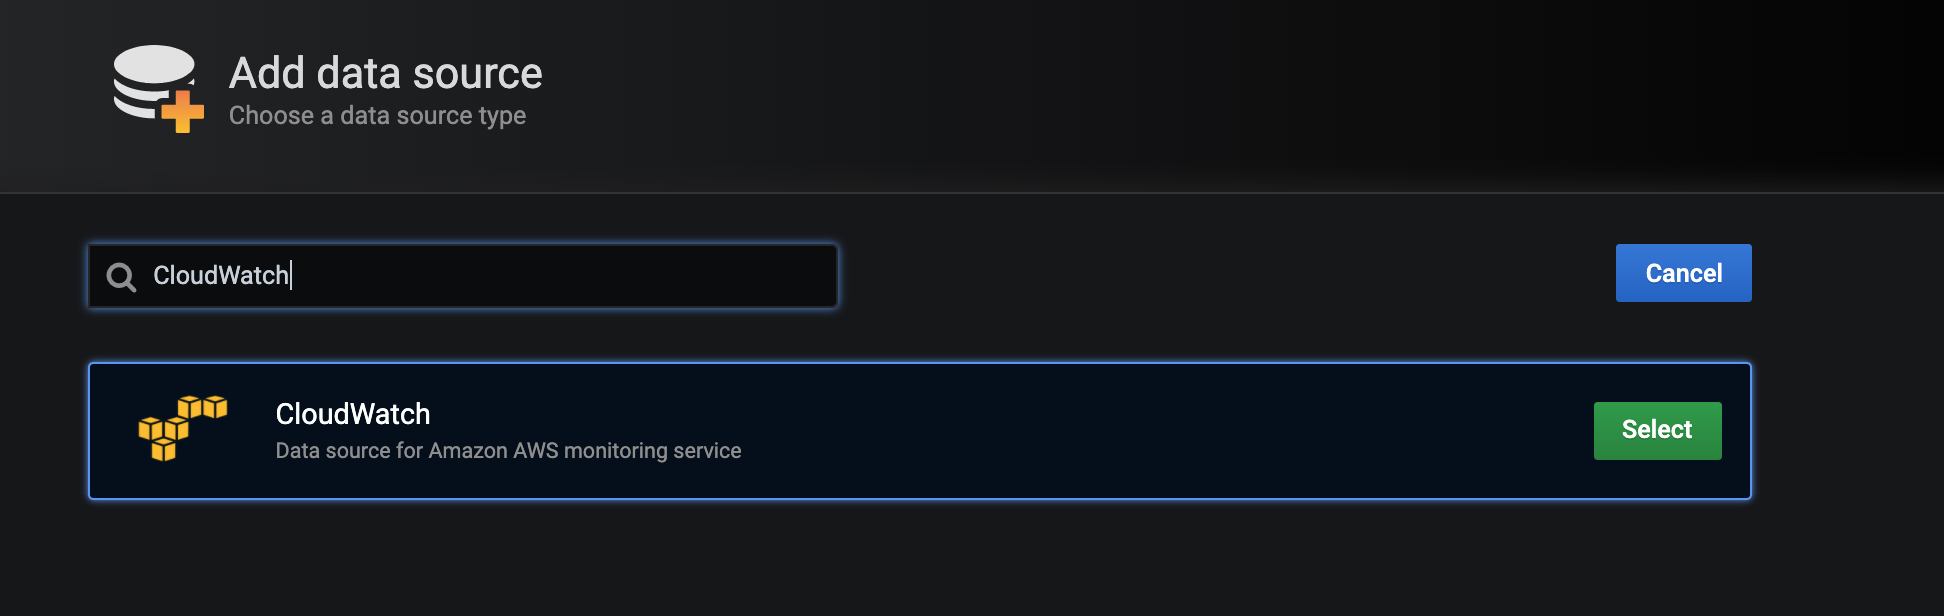
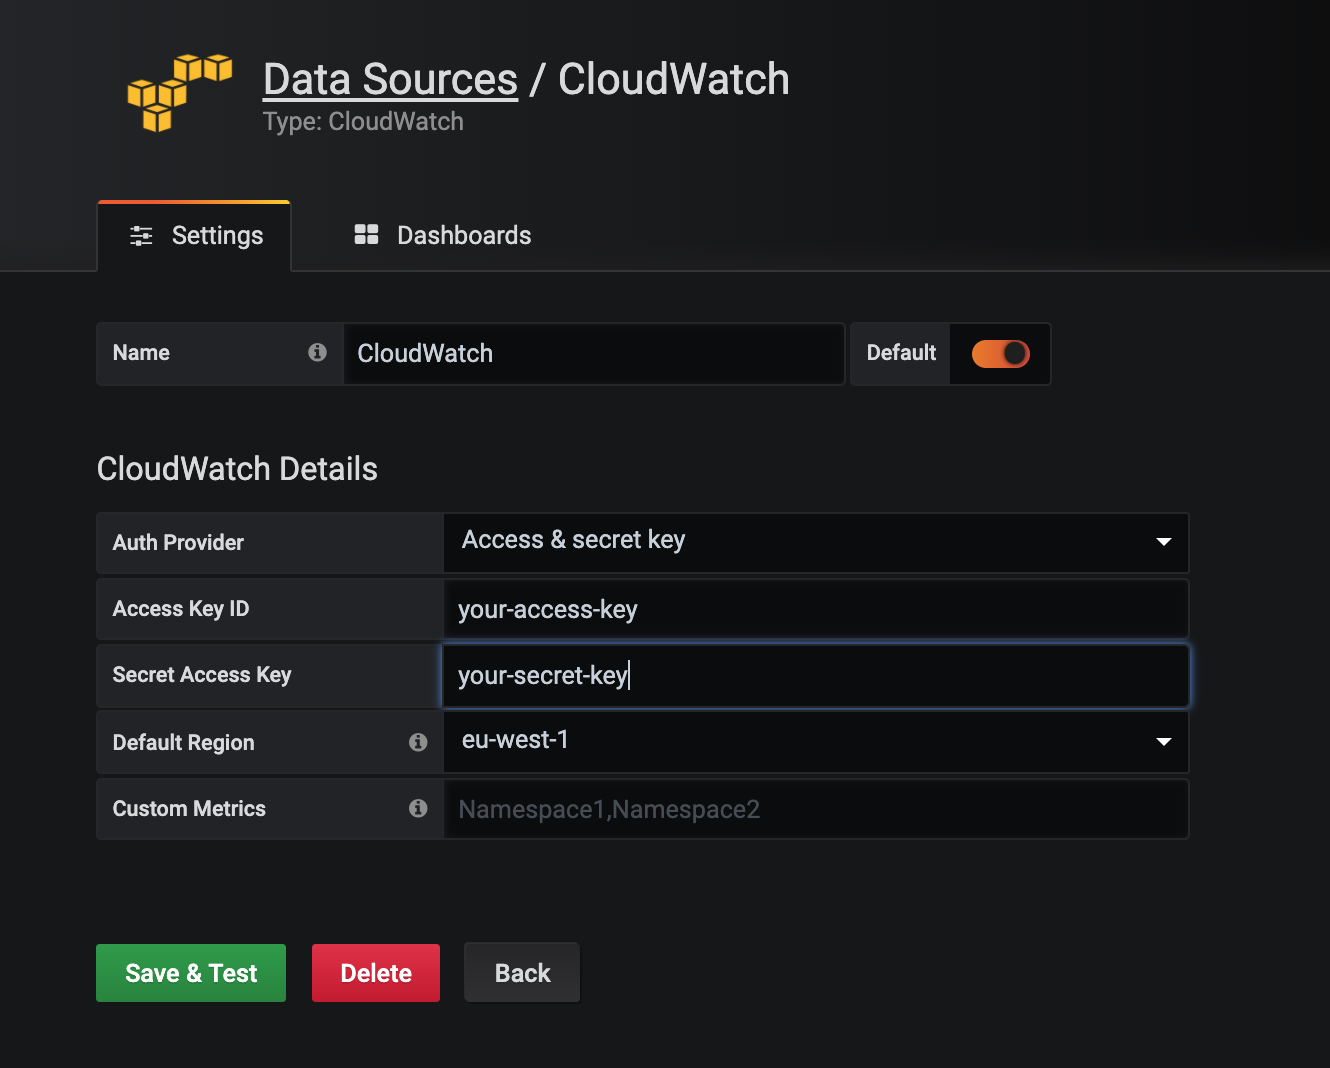
Select CloudWatch:
As we created a AWS IAM user, select Access & secret key as the Auth Provider, provide your Access Key ID and Secret Access Key and the select your AWS Region where your AWS Resources reside.
If you have more than one region, we will be able to override this with template variables.
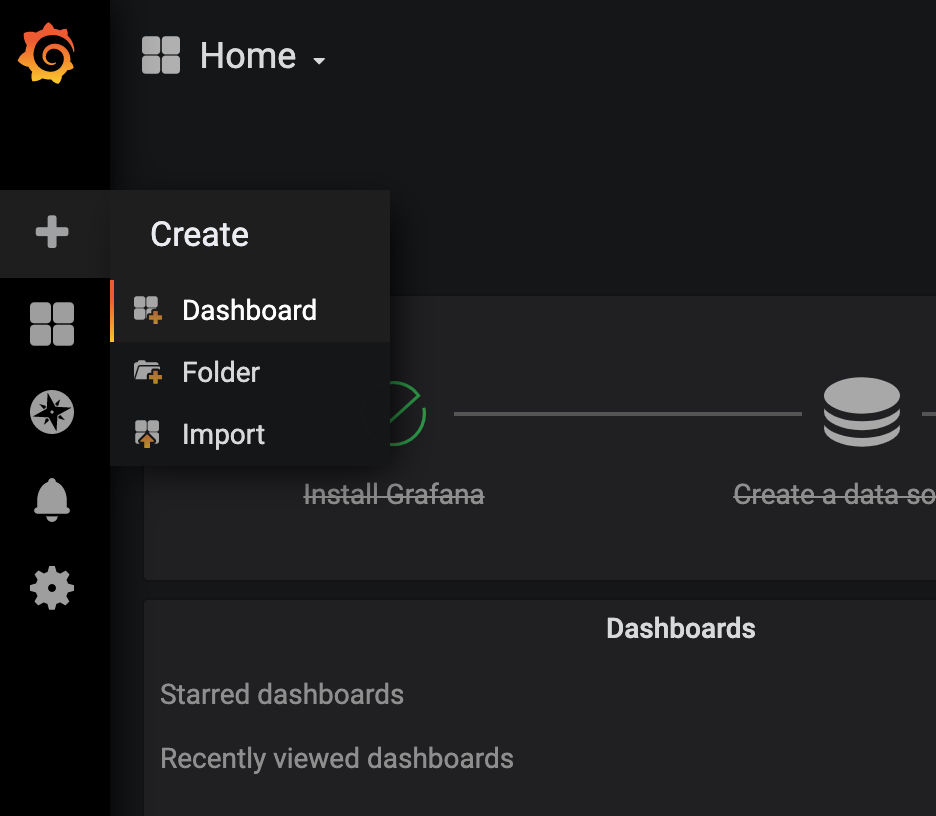
Once that is done, select save and test, then head back to the main screen and create your first dashboard:
CloudWatch Datasource Dashboard Basics
Let's explore our options when creating a dashboard with the AWS CloudWatch Data Source.
When creating a dashboard you will see this:
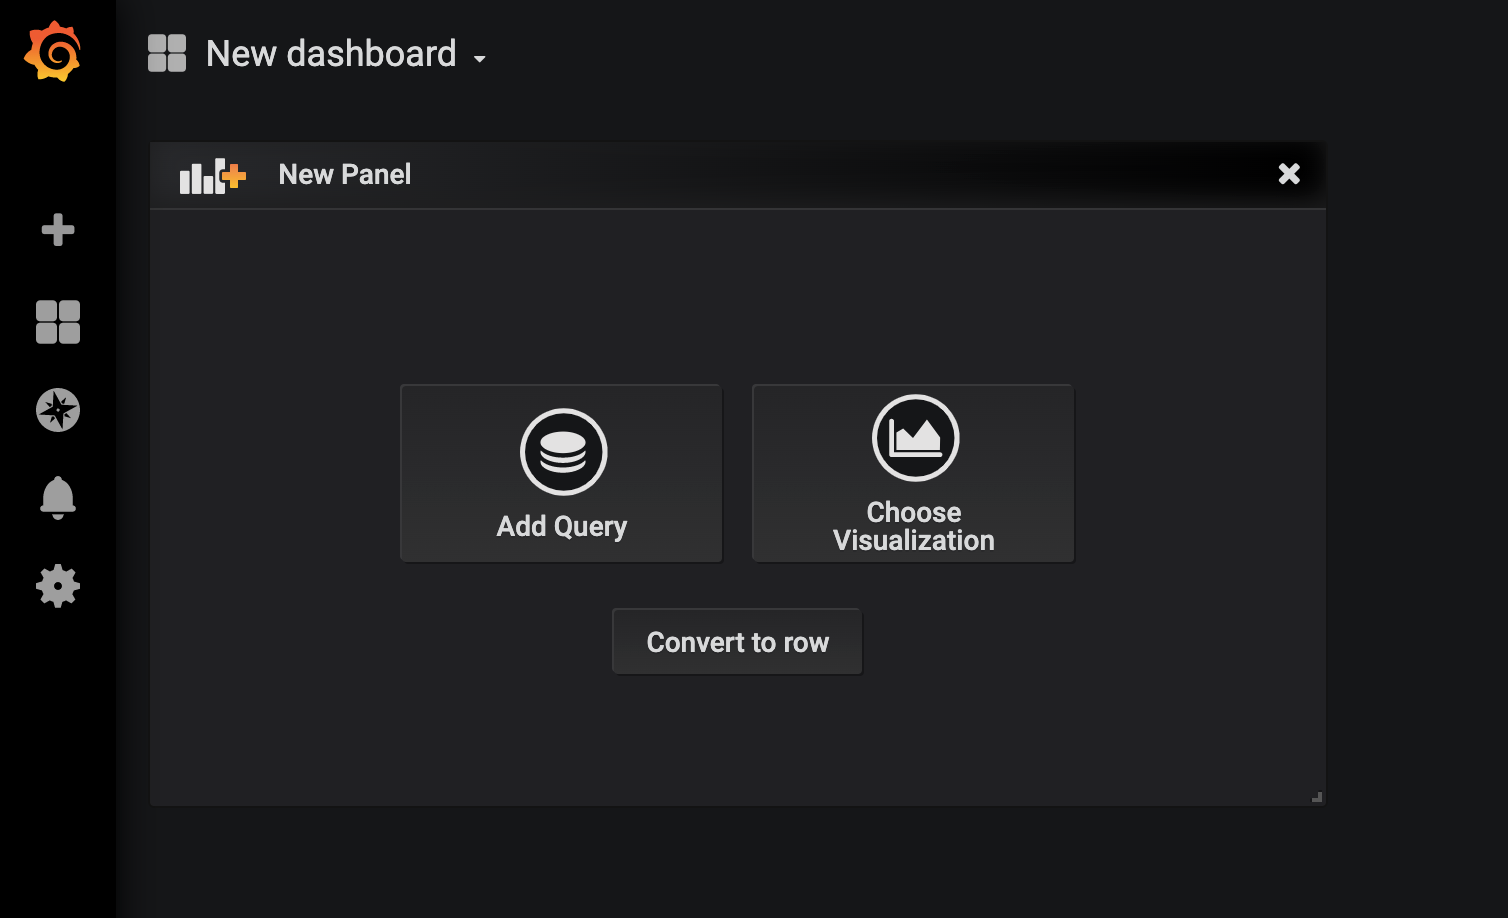
This will be the default view that you will see when you select "Add Query":

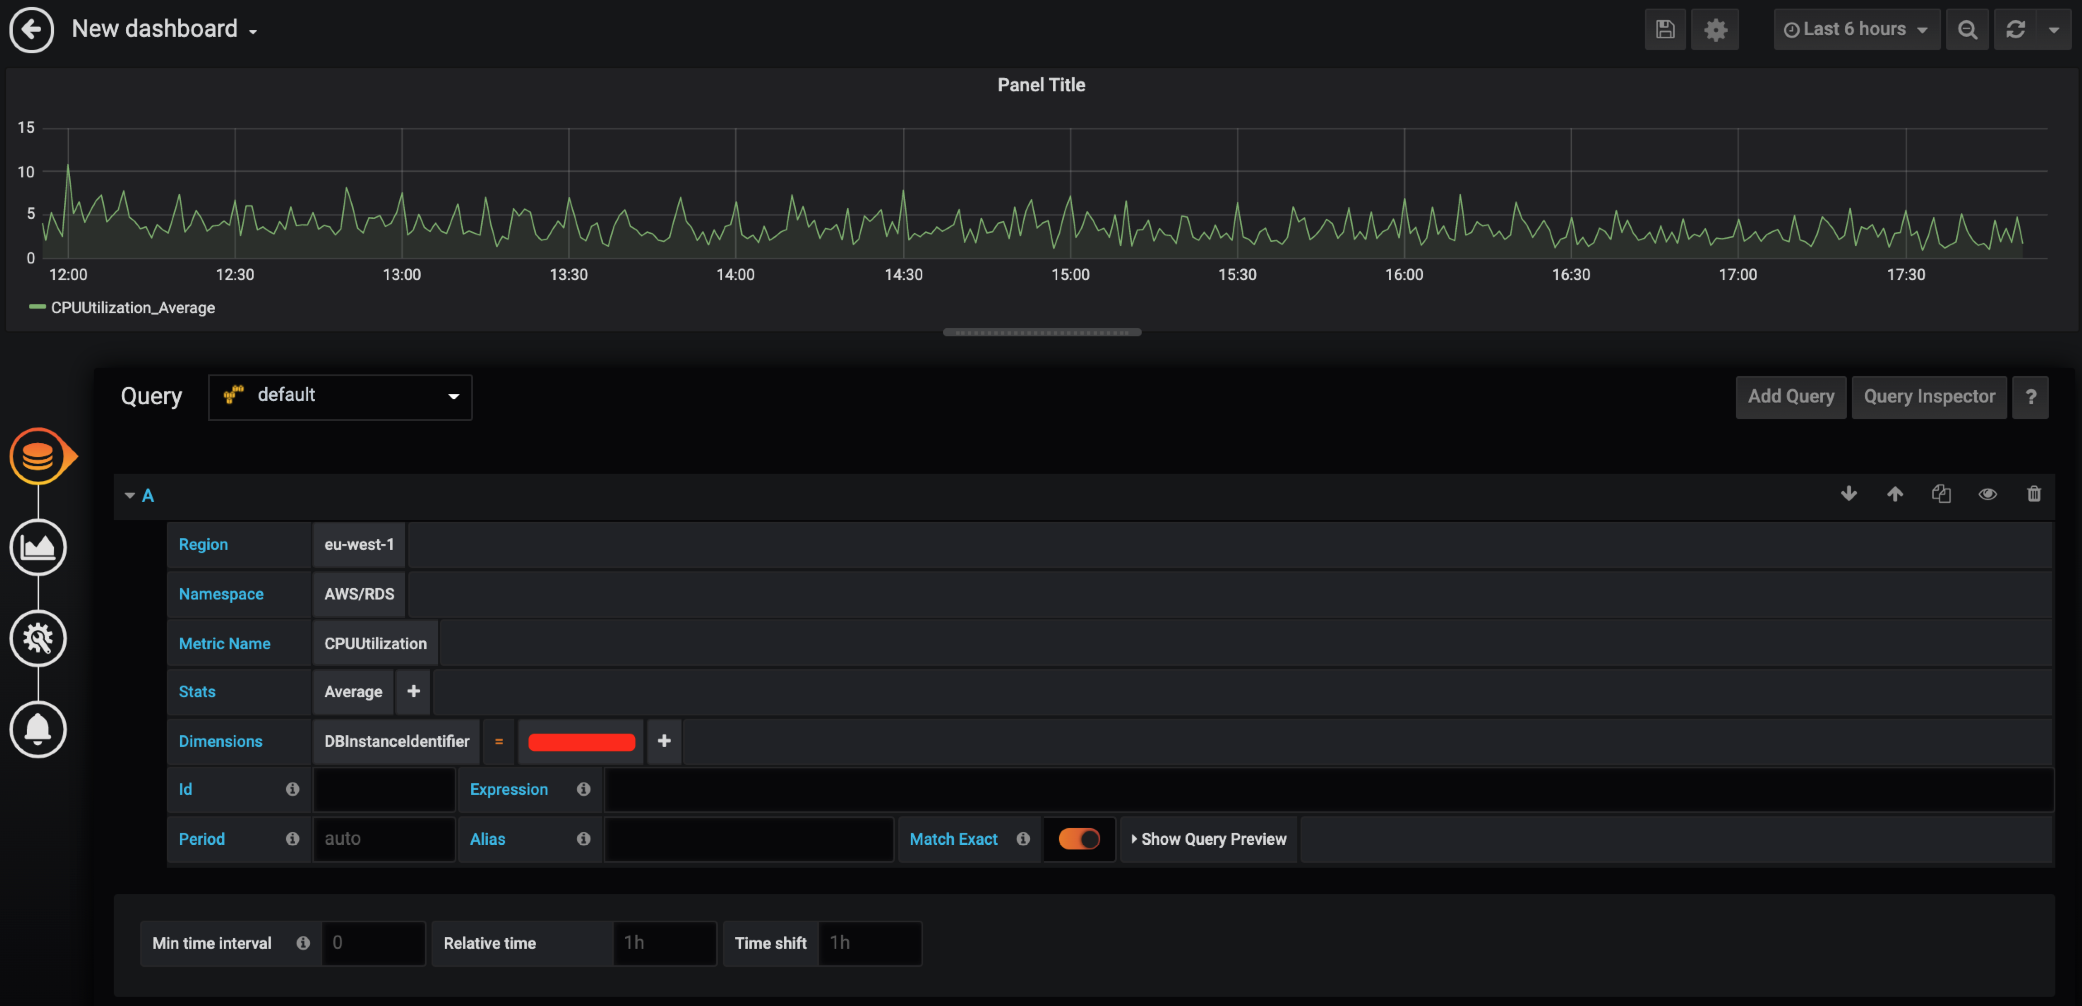
As you can see, from "Query: default" that points to our default data source which is CloudWatch, if we configured more than one data source, you can select it there.
The same with region, as we selected "eu-west-1" in our data source configuration, the default will point to eu-west-1, but if we want to query another region, we can select the target region from the drop down.
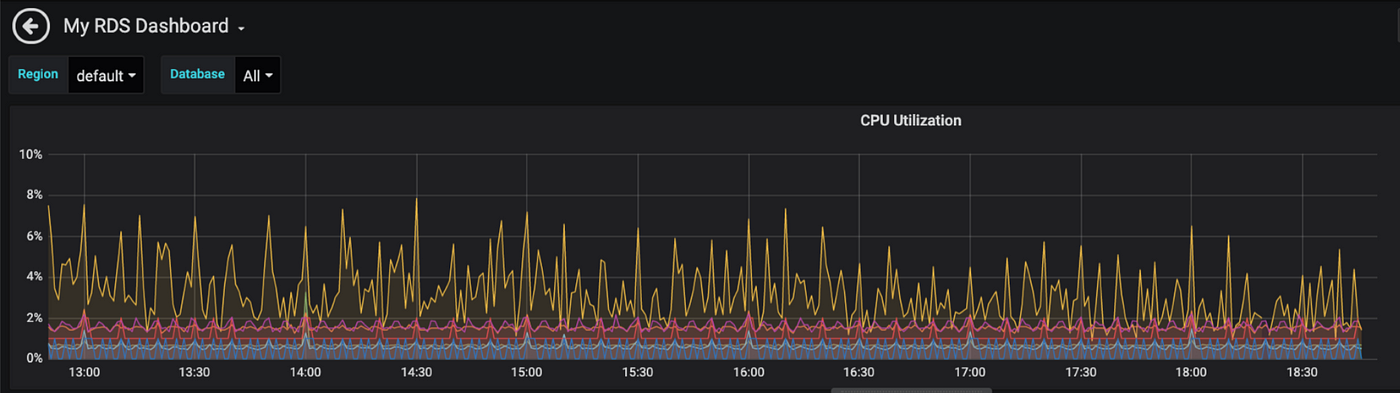
So let's take an example scenario. We need to create a dashboard (line graph) which would show us our CPU Utilization of our RDS Database (RDSInstance) but also need to include the min, average, max and current numbers.
From the query selector we will use the following:
- Region: eu-west-1
- Namespace: AWS/RDS
- Metric Name: CPUUtilization
- Stats: Average (average value per 60s)
- Dimensions: DBInstanceIdentifier = Select the RDS Instance that you want to monitor
We should now see something more or less like this:
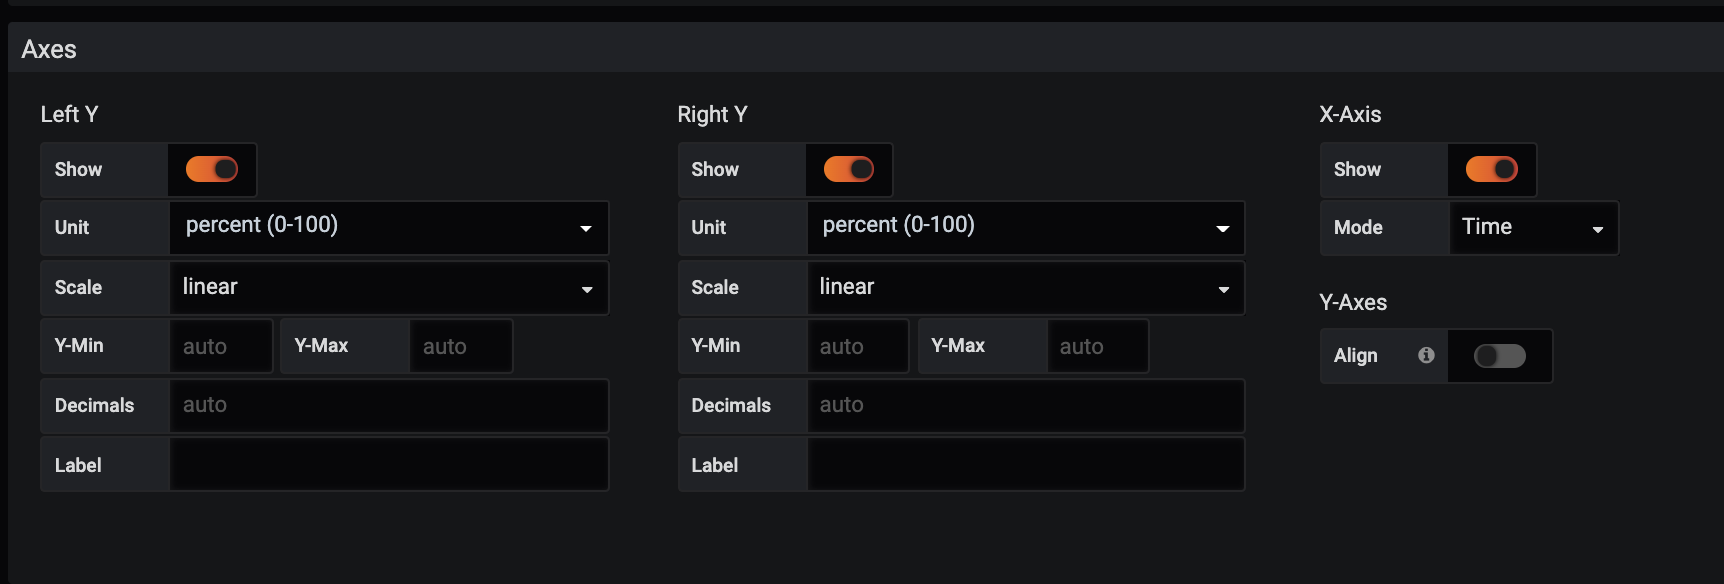
Now lets customize the view a bit, from the left select "Visualization":

As CPU Utilization is a Percentage value, we will need to change the Unit value from the Axes from short to percentage (0-100):
Now we want to modify the Legend section so that we can see the values of our metrics on the right hand side:

Now we should see a dashboard like this:

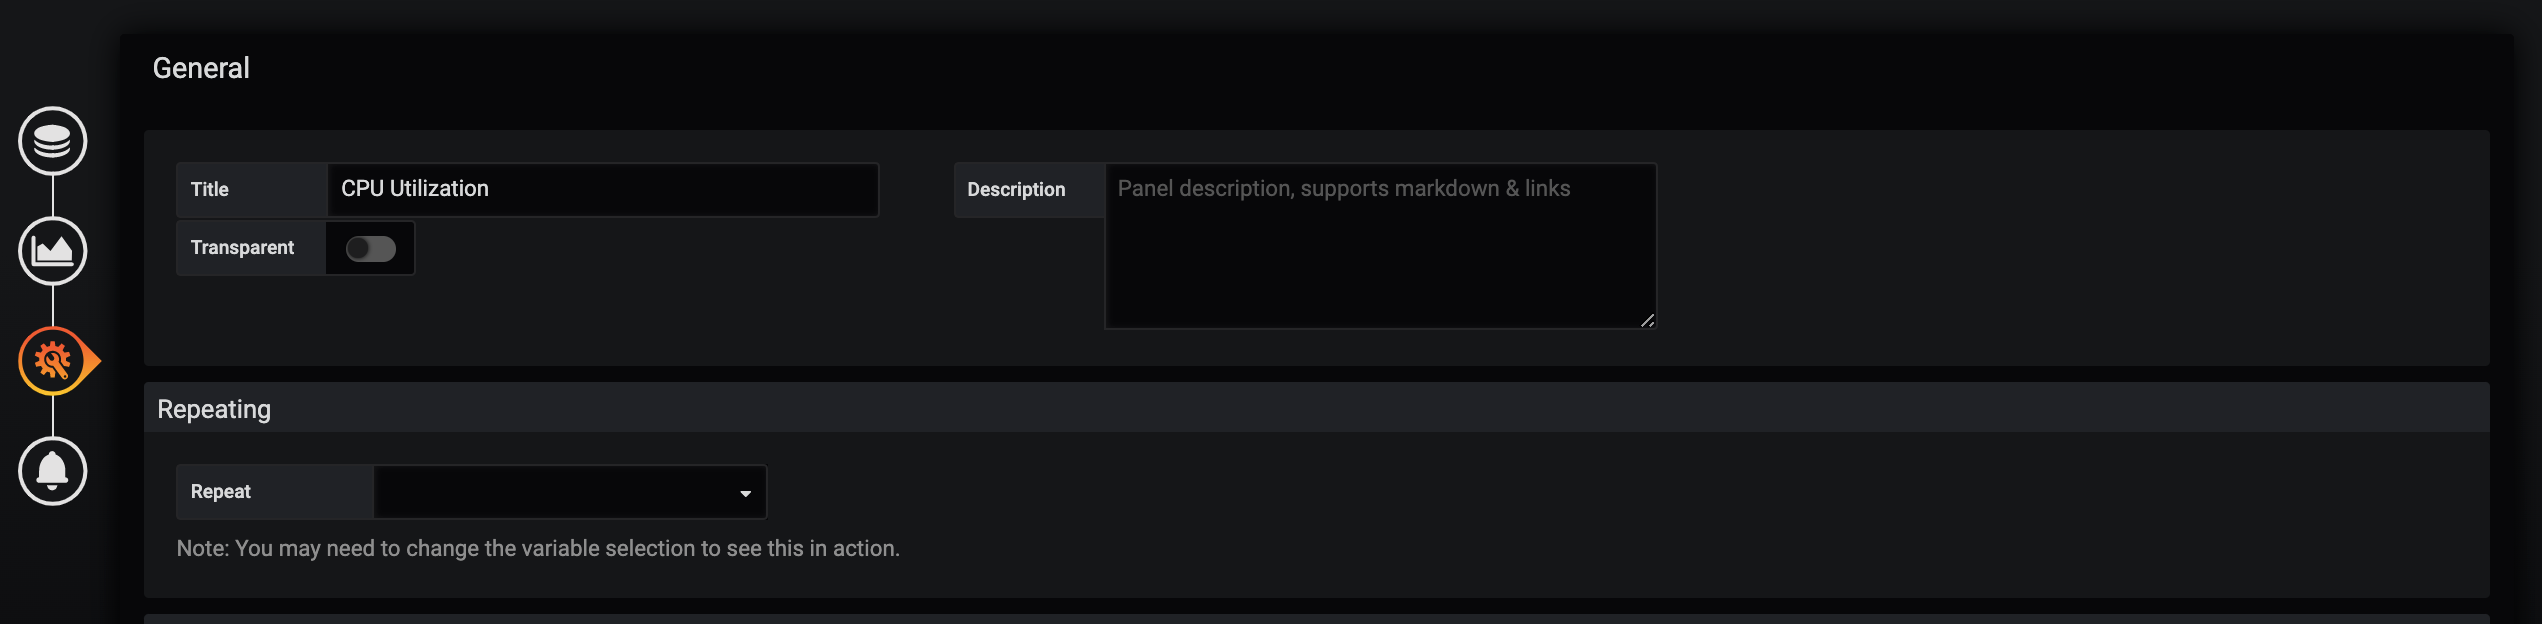
To name the Panel, on the left select settings and change the Title to something descriptive. The description value is also very useful, especially if you are monitoring complex things and you would like to provide context to the viewer.
Then as you can see our Legend shows the metric's key as CPUUtilization_average, we can overwrite that name with something different such as the RDS Instance name. This is useful when we are monitoring CPU Utilization for more than one RDS Resource.
To get the RDS Resource Identifier, we can use {{DBInstanceIdentifier}} in the Alias section of our Query section (more values in the docs) then we will see:

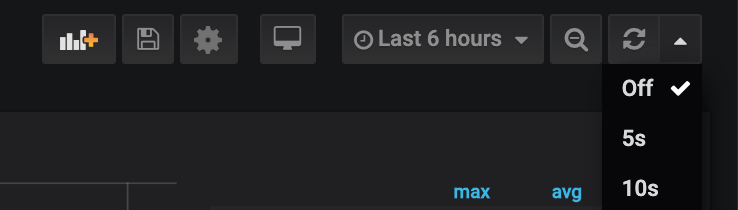
Now let's say we want to keep this dashboard running on a monitor and we want it to auto refresh every minute, we can do that by selecting the dropdown next to the refresh icon in the top right corner:
Once that is done, hit the gear icon to get to the dashboard settings:

Give your dashboard a descriptive name, add some tags to it and save your dashboard:

Now your dashboard should look something like this:

You can go ahead and add more panels to your dashboard, so that your dashboard can include everything related to your dashboard's description.
Dashboard Variables
Having to create dashboards with static values such as database names can bite you in the long run and a better way to do that is to use dynamic values with the help of Grafana's Variables.
In this example we would want to monitor CPU Utilization of all our RDS Instances across any AWS Region, but we would also like to only view a specific RDS Instance on a dropdown selection.
From your Dashboard, select dashboard settings on the top and head over to Variables on the left:
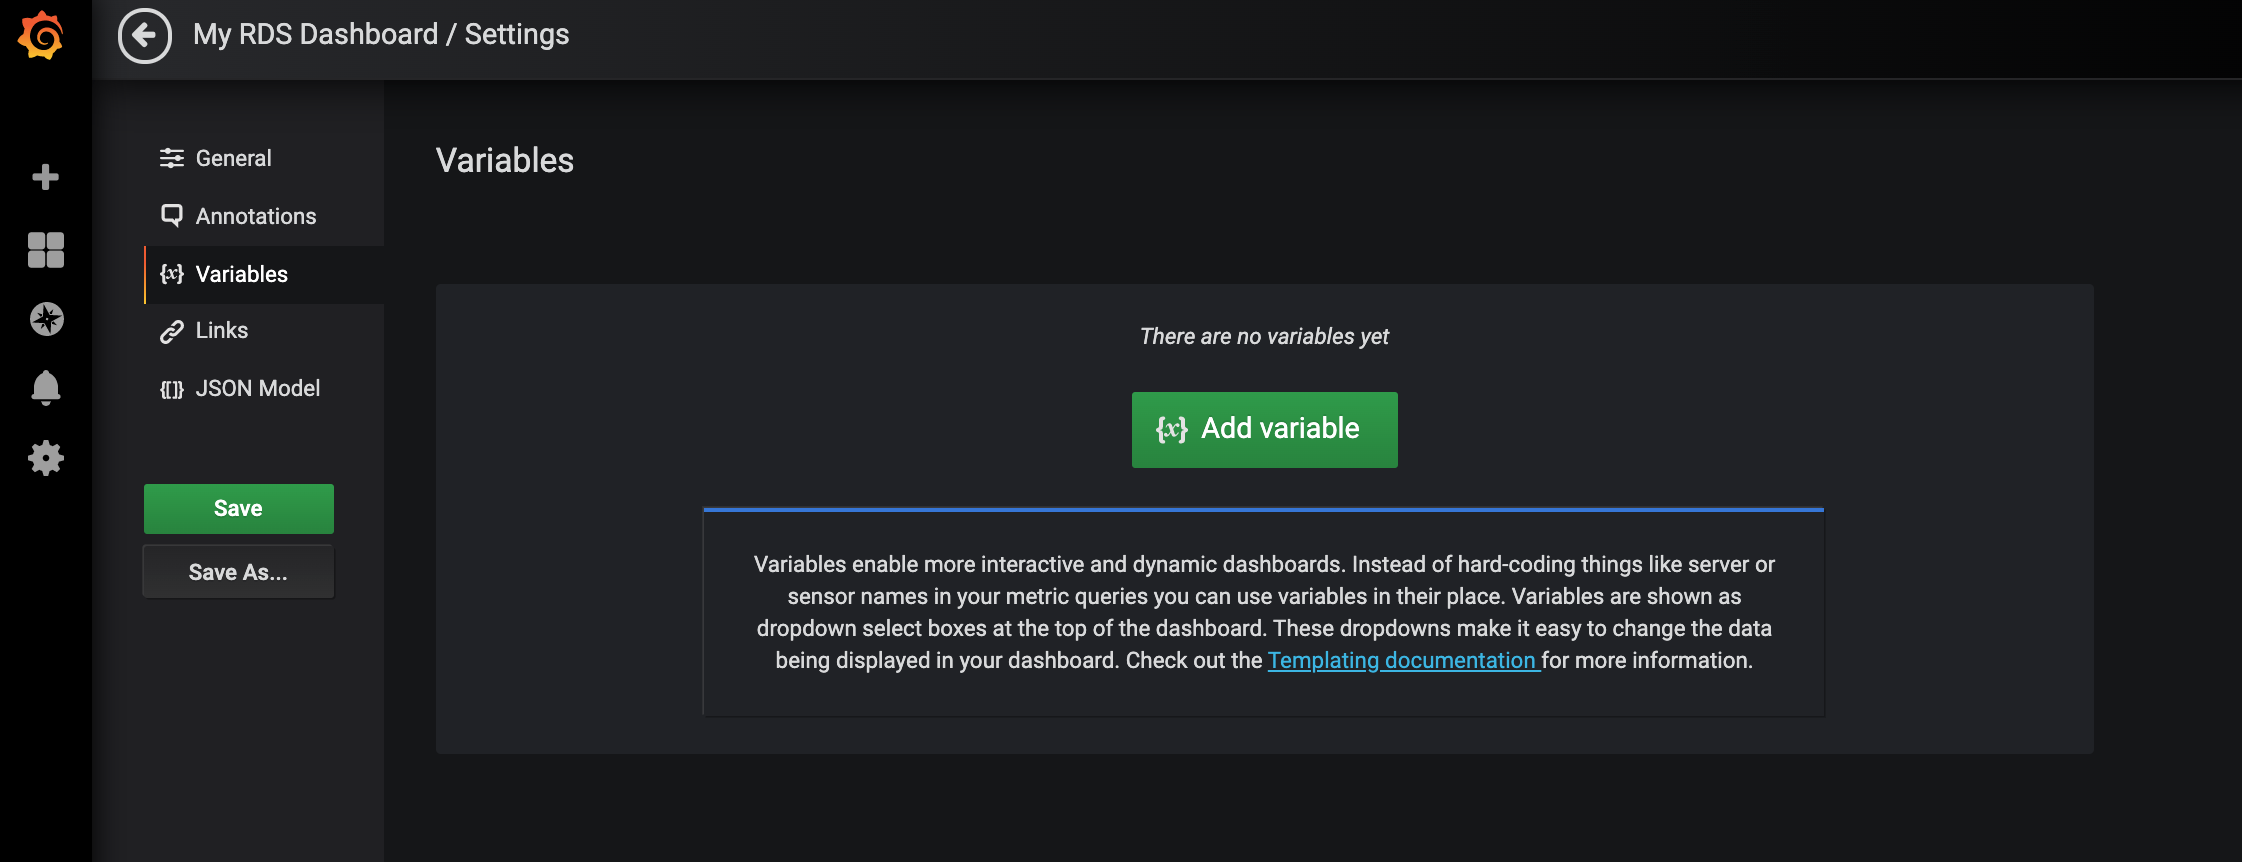
We will create 2 variables, "region" and "database". Go ahead and select "Add variable" and create the region variable.
We will use the variable as region as we will reference it with "$region" and label as Region for the key and the query being regions() .

Select add then save, then add the database variable, which we will use the variable name as database the label as Database and the query as dimension_values($region,AWS/RDS,CPUUtilization,DBInstanceIdentifier) and Refresh on Dashboard load so if new databases are provisioned our dashboard will be updated with the databases on dashboard load.
We will also require Multi-value and Include All option, so we can select specific databases that we want to look at, or have a view on CPU for all our databases:

Select add and save.
Note: If you are looking for more examples to get values from variables such as, getting EC2 InstanceId's from a Tag or EBS VolumeId from a EC2 instance, I started a cheatsheet that can help with this:
Updating our Dashboard with Dynamic Values
Let's update our RDS Dashboard to show us our CPU Utilization over all our databases.
When we return to our dashboard we will see the new dropdown selectors at the top:
Select your panel and select edit:

Now as we have a variable for region, we want to allow the dashboard to change upon a user's selection of the region selector.
From the query section, change the Region to $region and the value for DBInstanceIdentifier to $database:

This essentially queries the CloudWatch metrics for dimensions on the user's selection from the dropdown at the top.
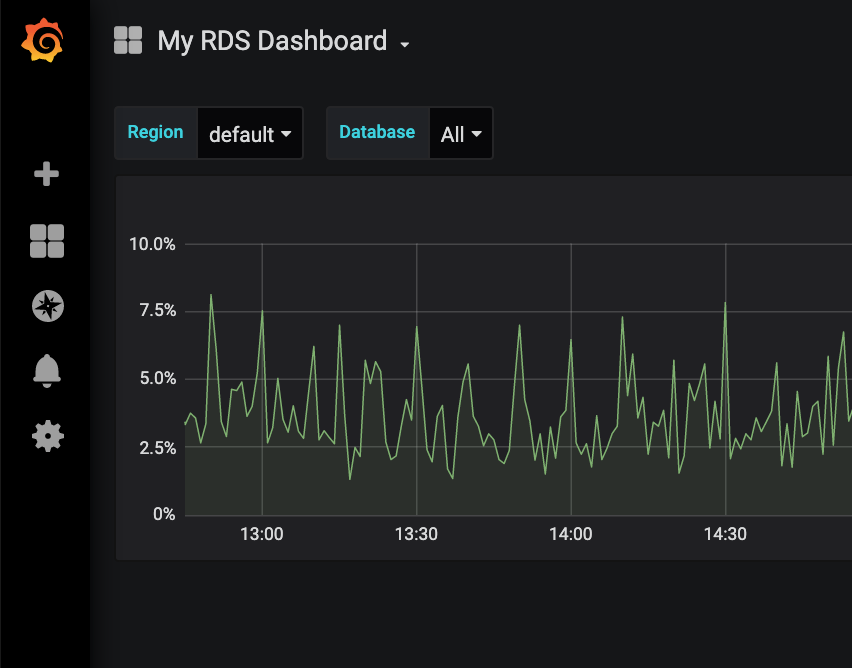
When we look at the dashboard now, we will see the average of CPU Utilization across all our RDS Database Instances across our selected AWS Region:

Now let's say we want to see metrics for only 2 Databases:

After selecting the databases that you want to see:

Pretty neat right? :-D
Import AWS Dashboards from Grafana
Grafana has a lot of pre-created dashboards that you can import from, for example a AWS/RDS Dashboard with the CloudWatch Data source:
Copy the dashboard id (707 in this case)

From Grafana, select import from the left hand side:

Provide the ID:

Select the Datasource and import:

After your import when you look at your dashboard you will see something like this:

Huge credit goes to MonitoringArtist for building all these amazing dashboards and making them available on Grafana.
To have a look at all the available AWS Dashboards, have a look at the following link and import as much as you can :D
Thank You
I hope you found this useful, if you liked my content, feel free to follow me on twitter at @ruanbekker
Comments