
In this tutorial, we will connect the DHT22 sensor to the Raspberry Pi Zero via the GPIO pins to measure temperature and humidity and visualize it with Grafana.
Note: This post was originally posted on my RaspberryPi Blog
Then we will write a Python exporter for prometheus to expose our metrics so that we can visualize it in Grafana.
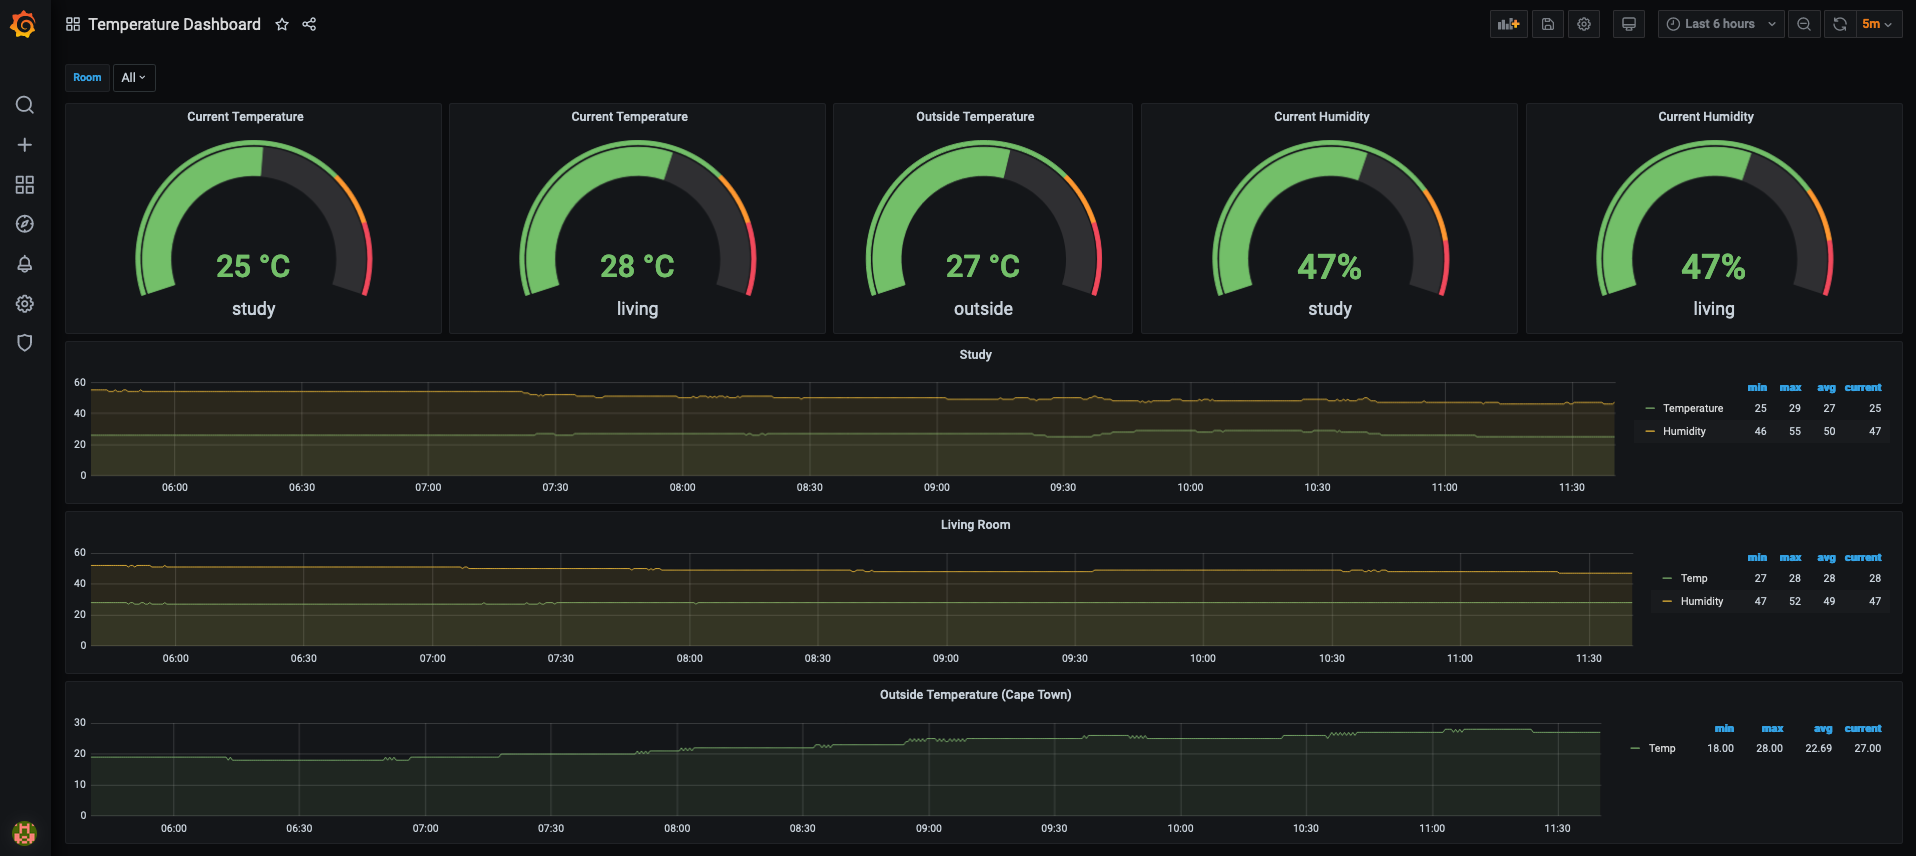
The Endgoal
The Hardware
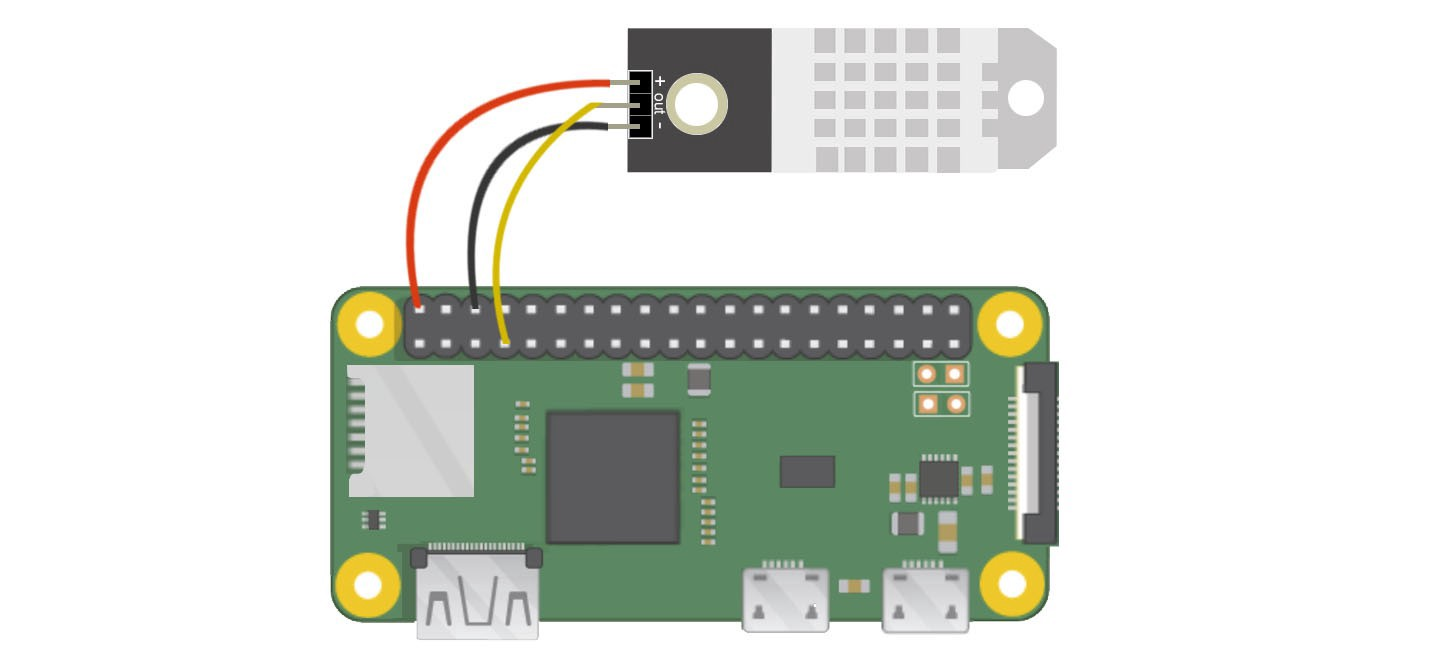
This is how the sensor looks like (I got it from Communica)

Connecting the Sensor
You can use the following graphic to connect your sensor to your raspberry pi:
Installing Software
To install the required software, we will be using pip:
$ pip3 install Adafruit_DHT --user
Once we installed the software we can configure it
Interact with the Sensor
Enter your python interpreter:
$ python3
>>>
Then import the library, and get the current temperature and humidity:
>>> import Adafruit_DHT as dht
>>> humidity, temperature = dht.read_retry(dht.DHT22, 4)
>>> humidity = format(humidity, ".2f") + "%"
>>> humidity
'47.20%'
>>> temperature = format(temperature, ".2f") + "C"
>>> temperature
'29.10C'
Let's create a python script for it:
$ cat temps.py
#!/usr/bin/env python3

import Adafruit_DHT as dht_sensor
import time

def get_temperature_readings():
    humidity, temperature = dht_sensor.read_retry(dht_sensor.DHT22, 4)
    humidity = format(humidity, ".2f") + "%"
    temperature = format(temperature, ".2f") + "C"
    return {"temperature": temperature, "humidity": humidity}

while True:
    print(get_temperature_readings())
    time.sleep(30)
And run it:
$ python3 temps.py
{'temperature': '28.00C', 'humidity': '47.40%'}
{'temperature': '28.00C', 'humidity': '47.30%'}
{'temperature': '28.00C', 'humidity': '47.70%'}
{'temperature': '28.00C', 'humidity': '47.40%'}
{'temperature': '28.00C', 'humidity': '47.60%'}
Visualize with Grafana
Let's visualize our data with Grafana. For this, we need to write an exporter so that Prometheus can scrape the data.
Let's create a python flask application with the prometheus client library for python to expose the metrics to prometheus with a /metrics endpoint.
Note: I have used OpenWeatherMap's API to get the outside temperature for my location.
$ cat flask_temps.py
#!/usr/bin/env python3

import Adafruit_DHT as dht_sensor
import time
from flask import Flask, Response
from prometheus_client import Counter, Gauge, start_http_server, generate_latest
import requests

params = {"lat": "-xx.xxxxx", "lon": "xx.xxxx", "units": "metric", "appid": "your-api-key"}
baseurl = "https://api.openweathermap.org/data/2.5/weather"
content_type = str('text/plain; version=0.0.4; charset=utf-8')

def get_temperature_readings():
    humidity, temperature = dht_sensor.read_retry(dht_sensor.DHT22, 4)
    humidity = format(humidity, ".2f")
    temperature = format(temperature, ".2f")
    outside_temp = get_outside_weather()
    if all(v is not None for v in [humidity, temperature, outside_temp]):
        response = {"temperature": temperature, "humidity": humidity, "outside_temp": outside_temp}
        return response
    else:
        time.sleep(0.2)
        humidity, temperature = dht_sensor.read_retry(dht_sensor.DHT22, 4)
        humidity = format(humidity, ".2f")
        temperature = format(temperature, ".2f")
        outside_temp = get_outside_weather()
        response = {"temperature": temperature, "humidity": humidity, "outside_temp": outside_temp}
        return response

def get_outside_weather():
    response = requests.get(baseurl, params=params)
    temp = response.json()['main']['temp']
    return temp

app = Flask(__name__)

current_humidity = Gauge(
        'current_humidity',
        'the current humidity percentage, this is a gauge as the value can increase or decrease',
        ['room']
)

current_temperature = Gauge(
        'current_temperature',
        'the current temperature in celsius, this is a gauge as the value can increase or decrease',
        ['room']
)

current_temperature_outside = Gauge(
        'current_temperature_outside',
        'the current outside temperature in celsius, this is a gauge as the value can increase or decrease',
        ['location']
)

@app.route('/metrics')
def metrics():
    metrics = get_temperature_readings()
    current_humidity.labels('study').set(metrics['humidity'])
    current_temperature.labels('study').set(metrics['temperature'])
    current_temperature_outside.labels('za_ct').set(metrics['outside_temp'])
    return Response(generate_latest(), mimetype=content_type)

if __name__ == '__main__':
    app.run(host='0.0.0.0', port=5000)
Then install the flask and prometheus_client package:
$ python3 -m pip install flask prometheus_client --user
When you run the program, you should be able to retrieve metrics from the exporter by making a request on port 5000 on the /metrics request path:
$ curl http://localhost:5000/metrics
# HELP python_gc_objects_collected_total Objects collected during gc
# TYPE python_gc_objects_collected_total counter
python_gc_objects_collected_total{generation="0"} 646.0
python_gc_objects_collected_total{generation="1"} 129.0
python_gc_objects_collected_total{generation="2"} 0.0
# HELP python_gc_objects_uncollectable_total Uncollectable object found during GC
# TYPE python_gc_objects_uncollectable_total counter
python_gc_objects_uncollectable_total{generation="0"} 0.0
python_gc_objects_uncollectable_total{generation="1"} 0.0
python_gc_objects_uncollectable_total{generation="2"} 0.0
# HELP python_gc_collections_total Number of times this generation was collected
# TYPE python_gc_collections_total counter
python_gc_collections_total{generation="0"} 104.0
python_gc_collections_total{generation="1"} 9.0
python_gc_collections_total{generation="2"} 0.0
# HELP python_info Python platform information
# TYPE python_info gauge
python_info{implementation="CPython",major="3",minor="7",patchlevel="3",version="3.7.3"} 1.0
# HELP process_virtual_memory_bytes Virtual memory size in bytes.
# TYPE process_virtual_memory_bytes gauge
process_virtual_memory_bytes 4.4761088e+07
# HELP process_resident_memory_bytes Resident memory size in bytes.
# TYPE process_resident_memory_bytes gauge
process_resident_memory_bytes 2.7267072e+07
# HELP process_start_time_seconds Start time of the process since unix epoch in seconds.
# TYPE process_start_time_seconds gauge
process_start_time_seconds 1.61044381853e+09
# HELP process_cpu_seconds_total Total user and system CPU time spent in seconds.
# TYPE process_cpu_seconds_total counter
process_cpu_seconds_total 5.86
# HELP process_open_fds Number of open file descriptors.
# TYPE process_open_fds gauge
process_open_fds 6.0
# HELP process_max_fds Maximum number of open file descriptors.
# TYPE process_max_fds gauge
process_max_fds 1024.0
# HELP current_humidity the current humidity percentage, this is a gauge as the value can increase or decrease
# TYPE current_humidity gauge
current_humidity{room="study"} 47.0
# HELP current_temperature the current temperature in celsius, this is a gauge as the value can increase or decrease
# TYPE current_temperature gauge
current_temperature{room="study"} 25.7
# HELP current_temperature_outside the current outside temperature in celsius, this is a gauge as the value can increase or decrease
# TYPE current_temperature_outside gauge
current_temperature_outside{location="za_ct"} 27.97
Now to configure our prometheus scrape config to scrape our endpoint:
$ cat /etc/prometheus/prometheus.yml
...
scrape_configs:
  - job_name: 'temperature-exporter'
    scrape_interval: 15s
    static_configs:
    - targets: ['192.168.0.5:5000']
      labels:
        instance: 'pi-zero'
        room: 'study'
Then restart prometheus and head over to Grafana.
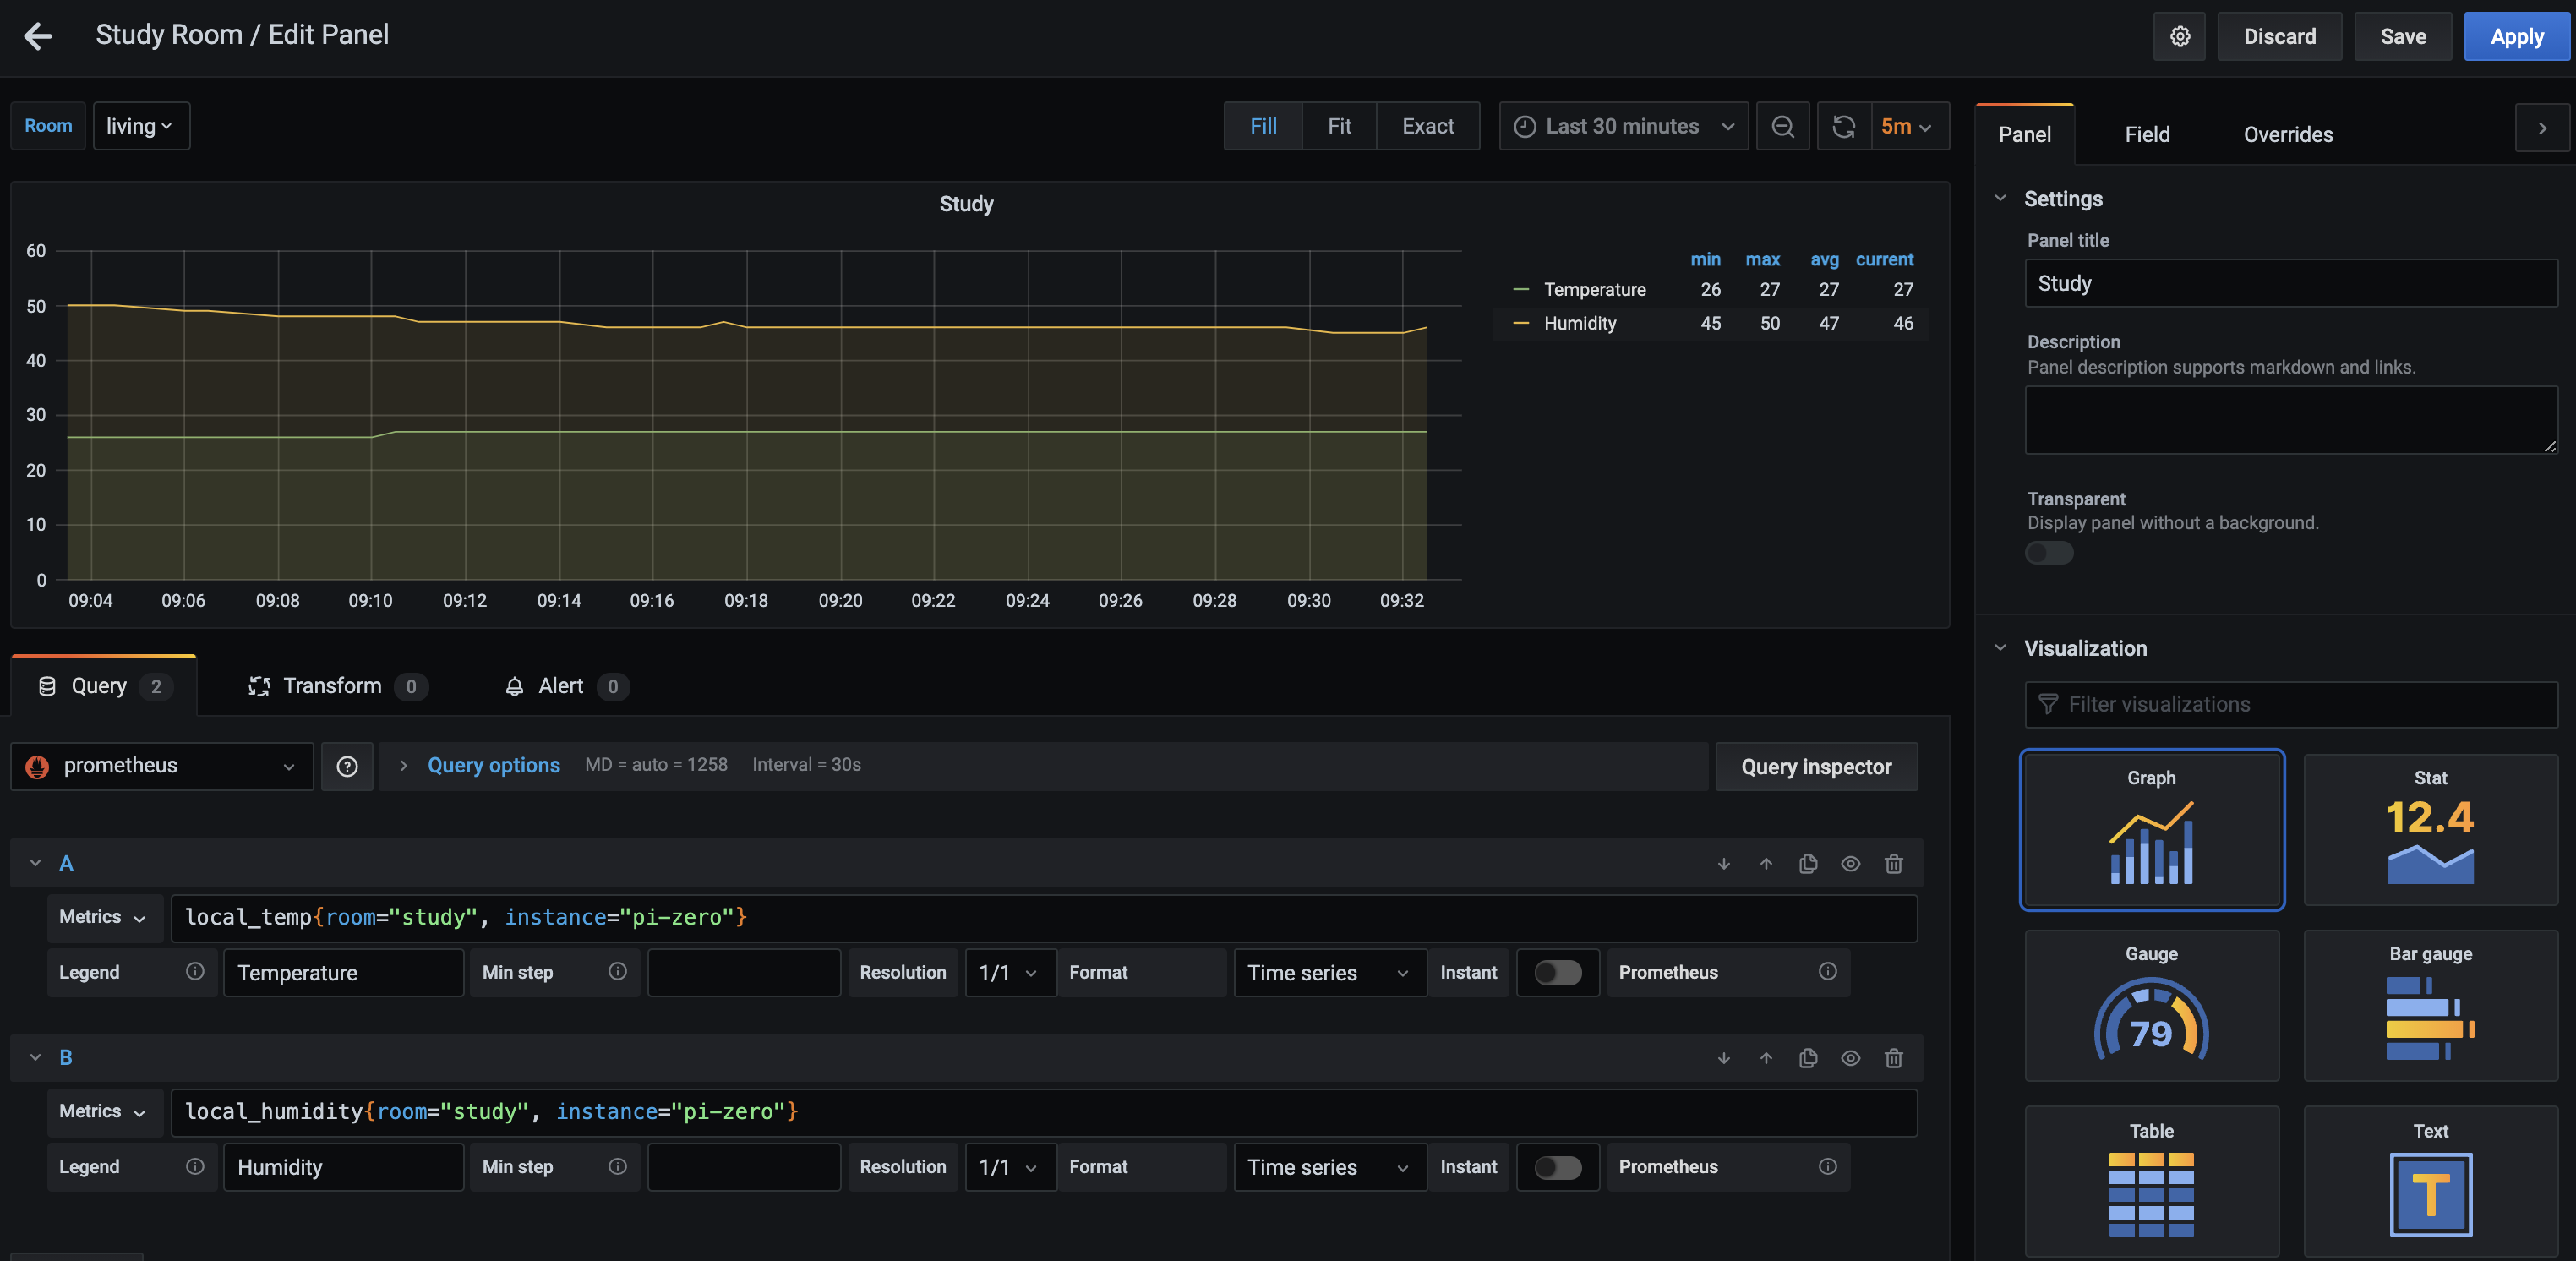
We will be adding a new panel with a graph visualization, and from our prometheus datasource, we will be referencing the 2 metrics (different from the screenshot):
current_humidity{room="study"} 47.0
current_temperature{room="study"} 25.7
current_temperature_outside{location="za_ct"} 27.97
As can be seen below:
After a bit of customization, you can get something more or less like this:
Thank You
Thanks for reading, if you like my content feel free to visit my website ruan.dev or follow me on Twitter @ruanbekker
Comments