

Prometheus is one of those awesome open source monitoring services that I simply cannot live without. Prometheus is a Time Series Database that collects metrics from services using it's exporters functionality. Prometheus has its own query language called PromQL and makes graphing epic visualiztions with services such as Grafana a breeze.
What are we doing today
We will install the prometheus service and set up node_exporter to consume node related metrics such as cpu, memory, io etc that will be scraped by the exporter configuration on prometheus, which then gets pushed into prometheus's time series database. Which can then be used by services such as Grafana to visualize the data.
Other exporters is also available, such as: haproxy_exporter, blackbox_exporter etc, then you also get pushgateway which is used to push data to, and then your exporter configuration scrapes the data from the pushgateway endpoint. In a later tutorial, we will set up push gateway as well.
Install Prometheus
First, let's provision our dedicated system users for prometheus and node exporter:
$ useradd --no-create-home --shell /bin/false prometheus
$ useradd --no-create-home --shell /bin/false node_exporter
Create the directories for it's system files:
$ mkdir /etc/prometheus
$ mkdir /var/lib/prometheus
Apply the permissions:
$ chown prometheus:prometheus /etc/prometheus
$ chown prometheus:prometheus /var/lib/prometheus
Next, update your system:
$ apt update && apt upgrade -y
Let's install prometheus, head over to https://prometheus.io/download/ and get the latest version of prometheus:
$ wget https://github.com/prometheus/prometheus/releases/download/v2.8.0/prometheus-2.8.0.linux-amd64.tar.gz
$ tar -xf prometheus-2.8.0.linux-amd64.tar.gz
$ cp prometheus-2.8.0.linux-amd64/prometheus /usr/local/bin/
$ cp prometheus-2.8.0.linux-amd64/promtool /usr/local/bin/
$ chown prometheus:prometheus /usr/local/bin/prometheus
$ chown prometheus:prometheus /usr/local/bin/promtool
$ cp -r prometheus-2.8.0.linux-amd64/consoles /etc/prometheus/
$ cp -r prometheus-2.8.0.linux-amd64/console_libraries /etc/prometheus/
$ chown -R prometheus:prometheus /etc/prometheus/consoles
$ chown -R prometheus:prometheus /etc/prometheus/console_libraries
$ rm -rf prometheus-2.8.0.linux-amd64*
Configure Prometheus
We need to tell prometheus to scrape itself in order to get prometheus performance data, edit the prometheus configuration:
$ vim /etc/prometheus/prometheus.yml
And add a scrape config: Set the interval on when it needs to scrap, the job name which will be in your metric and the endpoint which it needs to scrape:
global:
  scrape_interval: 15s

scrape_configs:
  - job_name: 'prometheus'
    scrape_interval: 5s
    static_configs:
      - targets: ['localhost:9090']
Apply permissions to the configured file:
$ chown prometheus:prometheus /etc/prometheus/prometheus.yml
Next, we need to define a systemd unit file so we can control the daemon using systemd:
$ vim /etc/systemd/system/prometheus.service
The config:
[Unit]
Description=Prometheus
Wants=network-online.target
After=network-online.target

[Service]
User=prometheus
Group=prometheus
Type=simple
ExecStart=/usr/local/bin/prometheus \
    --config.file /etc/prometheus/prometheus.yml \
    --storage.tsdb.path /var/lib/prometheus/ \
    --web.console.templates=/etc/prometheus/consoles \
    --web.console.libraries=/etc/prometheus/console_libraries

[Install]
WantedBy=multi-user.target
Since we created a new systemd unit file, we need to reload the systemd daemon, then start the service:
$ systemctl daemon-reload
$ systemctl start prometheus
Let's look at the status to see if everything works as expected:
$ systemctl status prometheus
prometheus.service - Prometheus
   Loaded: loaded (/etc/systemd/system/prometheus.service; disabled; vendor preset: enabled)
   Active: active (running) since Tue 2019-03-26 11:59:10 UTC; 6s ago
 Main PID: 16374 (prometheus)
    Tasks: 9 (limit: 4704)
   CGroup: /system.slice/prometheus.service
           └─16374 /usr/local/bin/prometheus --config.file /etc/prometheus/prometheus.yml --storage.tsdb.path /var/lib/prometheus/ --web.console.templates=/etc/prometheus/consoles --web.console.libraries=

...
Mar 26 11:59:10 ip-172-31-41-126 prometheus[16374]: level=info ts=2019-03-26T11:59:10.893770598Z caller=main.go:655 msg="TSDB started"
Seems legit! Enable the service on startup:
$ systemctl enable prometheus
Install Node Exporter
Now since we have prometheus up and running, we can start adding exporters to publish data into our prometheus time series database. As mentioned before, with node exporter, we will allow prometheus to scrape the node exporter endpoint to consume metrics about the node:
You will find the latest version from their website, which I have added at the top of this post.
$ wget https://github.com/prometheus/node_exporter/releases/download/v0.17.0/node_exporter-0.17.0.linux-amd64.tar.gz
$ tar -xf node_exporter-0.17.0.linux-amd64.tar.gz
$ cp node_exporter-0.17.0.linux-amd64/node_exporter /usr/local/bin
$ chown node_exporter:node_exporter /usr/local/bin/node_exporter
$ rm -rf node_exporter-0.17.0.linux-amd64*
Create the systemd unit file:
$ vim /etc/systemd/system/node_exporter.service
Apply this configuration:
[Unit]
Description=Node Exporter
Wants=network-online.target
After=network-online.target

[Service]
User=node_exporter
Group=node_exporter
Type=simple
ExecStart=/usr/local/bin/node_exporter

[Install]
WantedBy=multi-user.target
Reload the systemd daemon and start node exporter:
$ systemctl daemon-reload
$ systemctl start node_exporter
Look at the status:
$ node_exporter.service - Node Exporter
   Loaded: loaded (/etc/systemd/system/node_exporter.service; disabled; vendor preset: enabled)
   Active: active (running) since Tue 2019-03-26 12:01:39 UTC; 5s ago
 Main PID: 16474 (node_exporter)
    Tasks: 4 (limit: 4704)
   CGroup: /system.slice/node_exporter.service
           └─16474 /usr/local/bin/node_exporter

...
Mar 26 12:01:39 ip-172-31-41-126 node_exporter[16474]: time="2019-03-26T12:01:39Z" level=info msg="Listening on :9100" source="node_exporter.go:111"
If everything looks good, enable the service on boot:
$ systemctl enable node_exporter
Configure Node Exporter
Now that we have node exporter running, we need to tell prometheus how to scrape node exporter, so that the node related metrics can end up into prometheus. Edit the prometheus config:
$ vim /etc/prometheus/prometheus.yml
I'm providing the full config, but the config is the last section, where you can see the jobname is node_exporter:
global:
  scrape_interval: 15s

scrape_configs:
  - job_name: 'prometheus'
    scrape_interval: 5s
    static_configs:
      - targets: ['localhost:9090']

  - job_name: 'node_exporter'
    scrape_interval: 5s
    static_configs:
      - targets: ['localhost:9100']
Once the config is saved, restart prometheus and have a look at the status if everything is going as expected:
$ systemctl restart prometheus
$ systemctl status prometheus
Nginx Reverse Proxy
Let's add a layer of security and front our setup with a nginx reverse proxy, so that we don't have to access prometheus on high ports and we have the option to enable basic http authentication. Install nginx:
$ apt install nginx apache2-utils -y
Create the authentication file:
$ htpasswd -c /etc/nginx/.htpasswd admin
Create the nginx site configuration, this will tel nginx to route connections on port 80, to reverse proxy to localhost, port 9090, if authenticated:
$ rm /etc/nginx/sites-enabled/default
$ vim /etc/nginx/sites-enabled/prometheus.conf
And this is the config:
server {
    listen 80 default_server;
    listen [::]:80 default_server;
    root /var/www/html;
    index index.html index.htm index.nginx-debian.html;
    server_name _;


    location / {
            auth_basic "Prometheus Auth";
            auth_basic_user_file /etc/nginx/.htpasswd;
            proxy_pass http://localhost:9090;
            proxy_http_version 1.1;
            proxy_set_header Upgrade $http_upgrade;
            proxy_set_header Connection 'upgrade';
            proxy_set_header Host $host;
            proxy_cache_bypass $http_upgrade;
        }
}
Reload nginx configuration:
$ systemctl reload nginx
Access the Beauty of Prometheus Land!
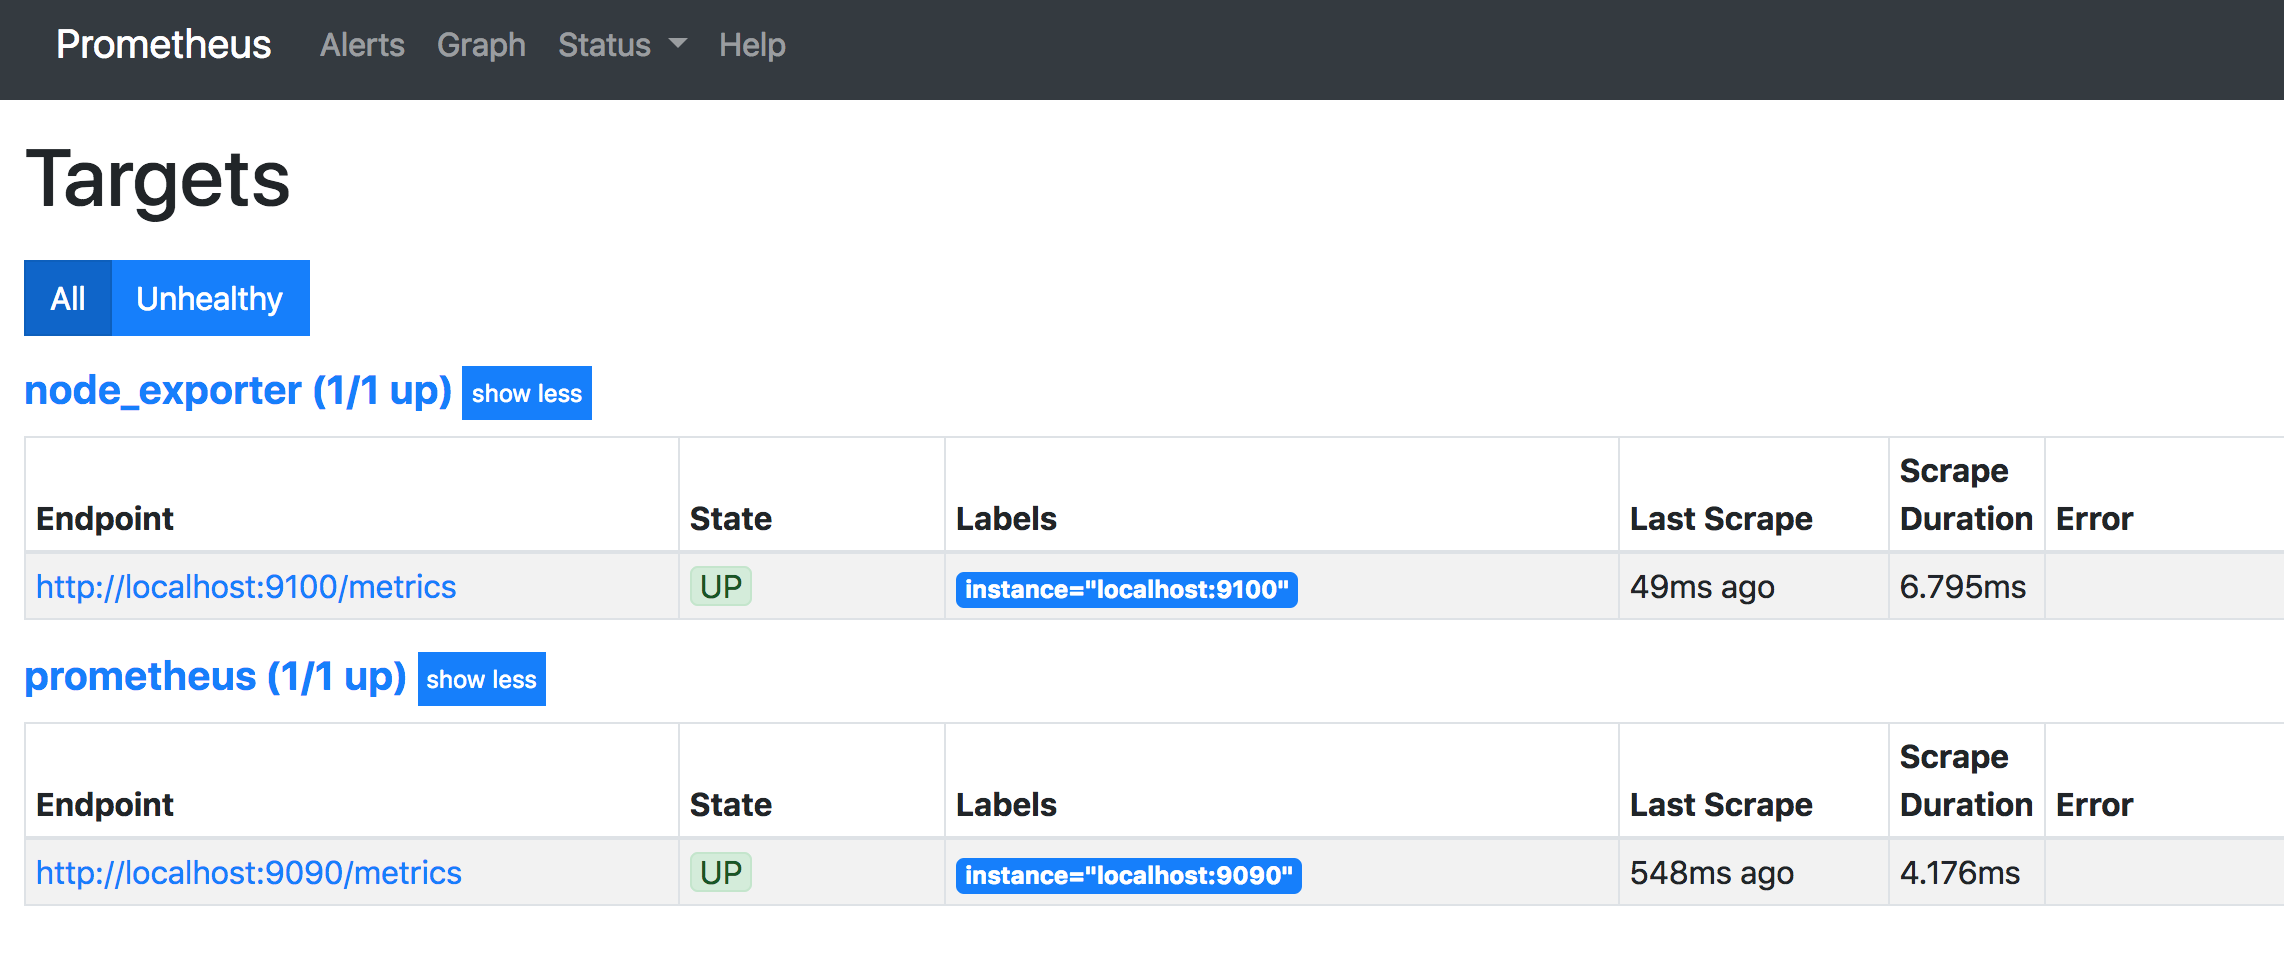
Once you have authenticated, head over to status, here you will see status info such as your targets, this wil be the endpoints that prometheus is scraping:
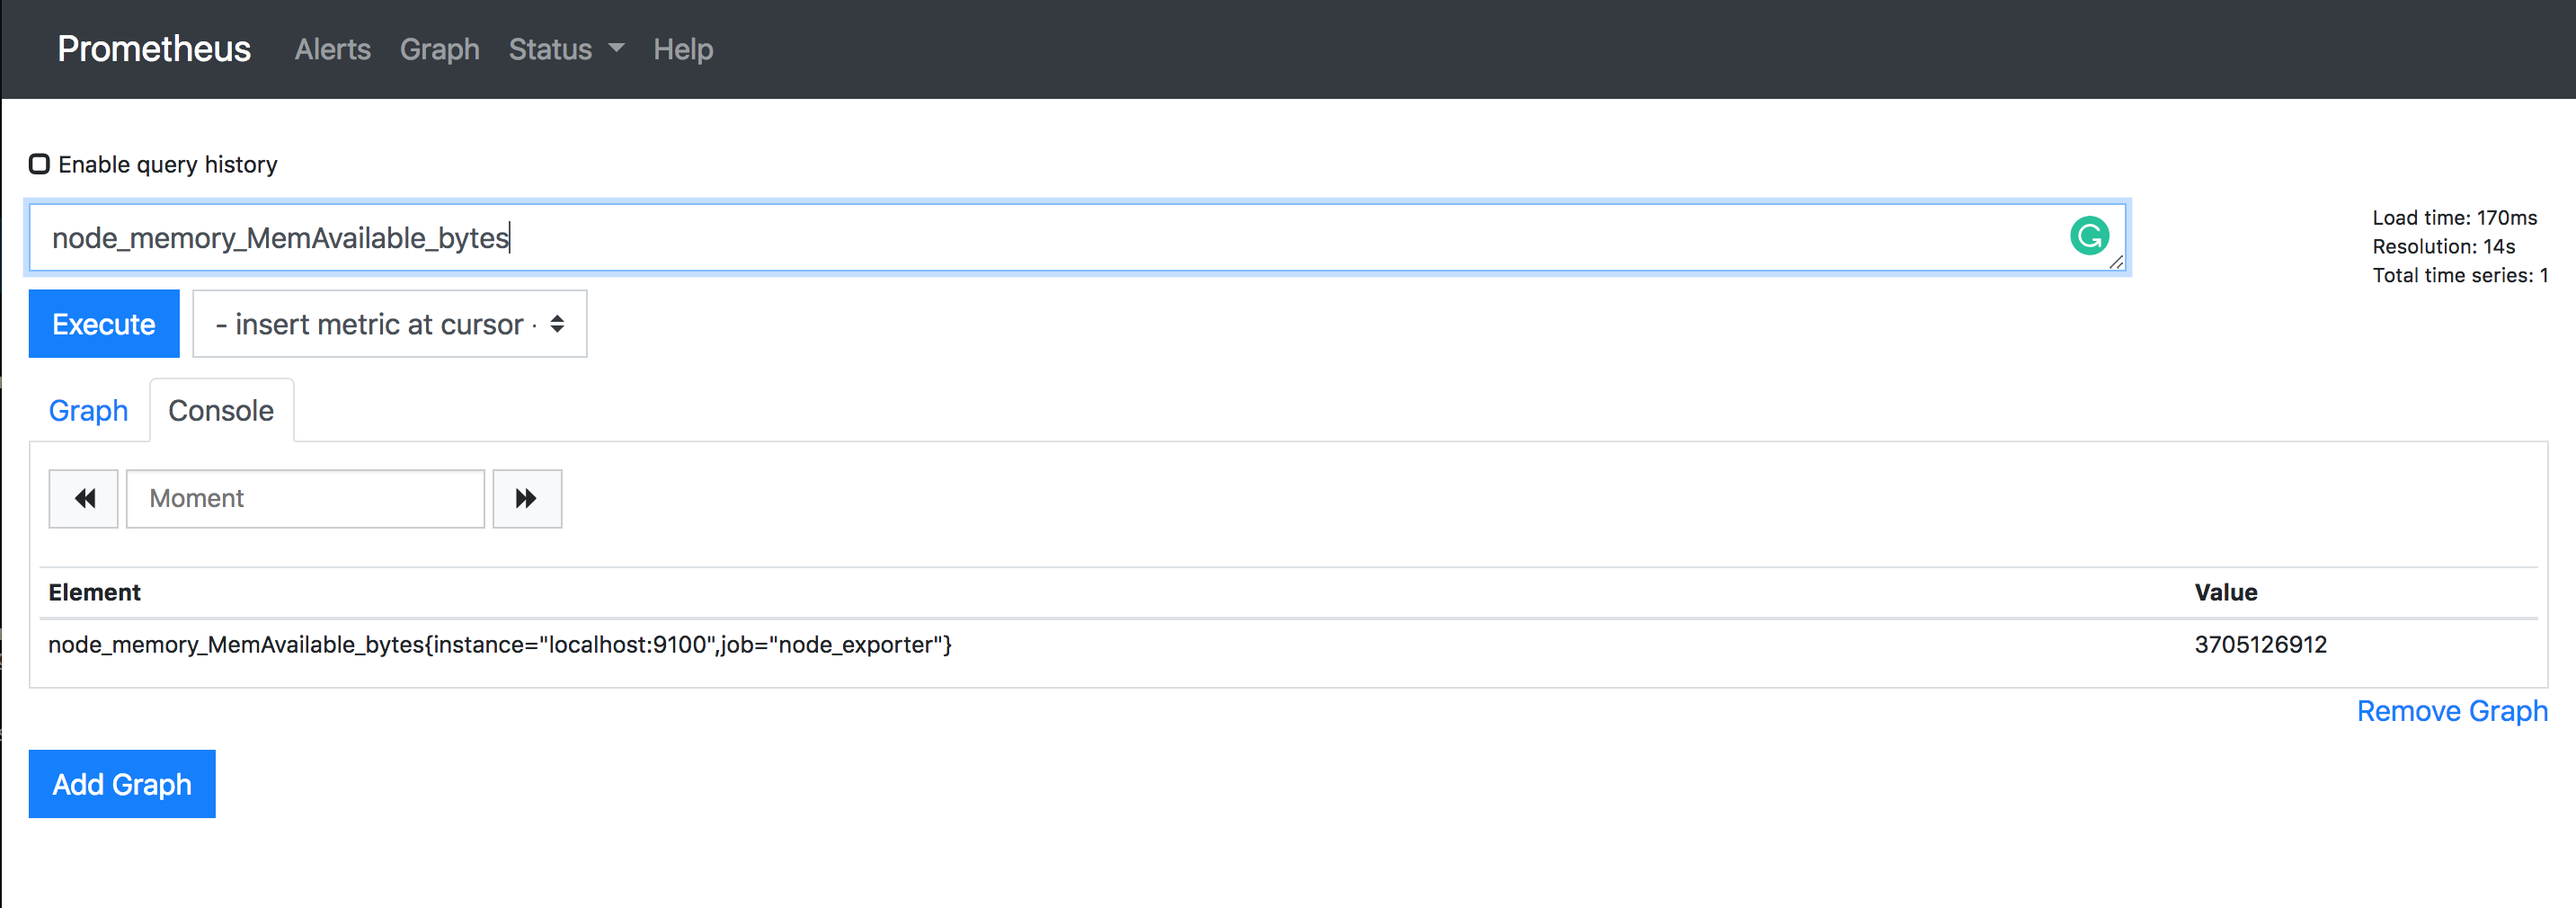
From the main screen, let's dive into some queries using PromQL. Also see my Prometheus Cheatsheet.
For the first query, we want to see the available memory of this node in bytes (node_memory_MemAvailable_bytes):
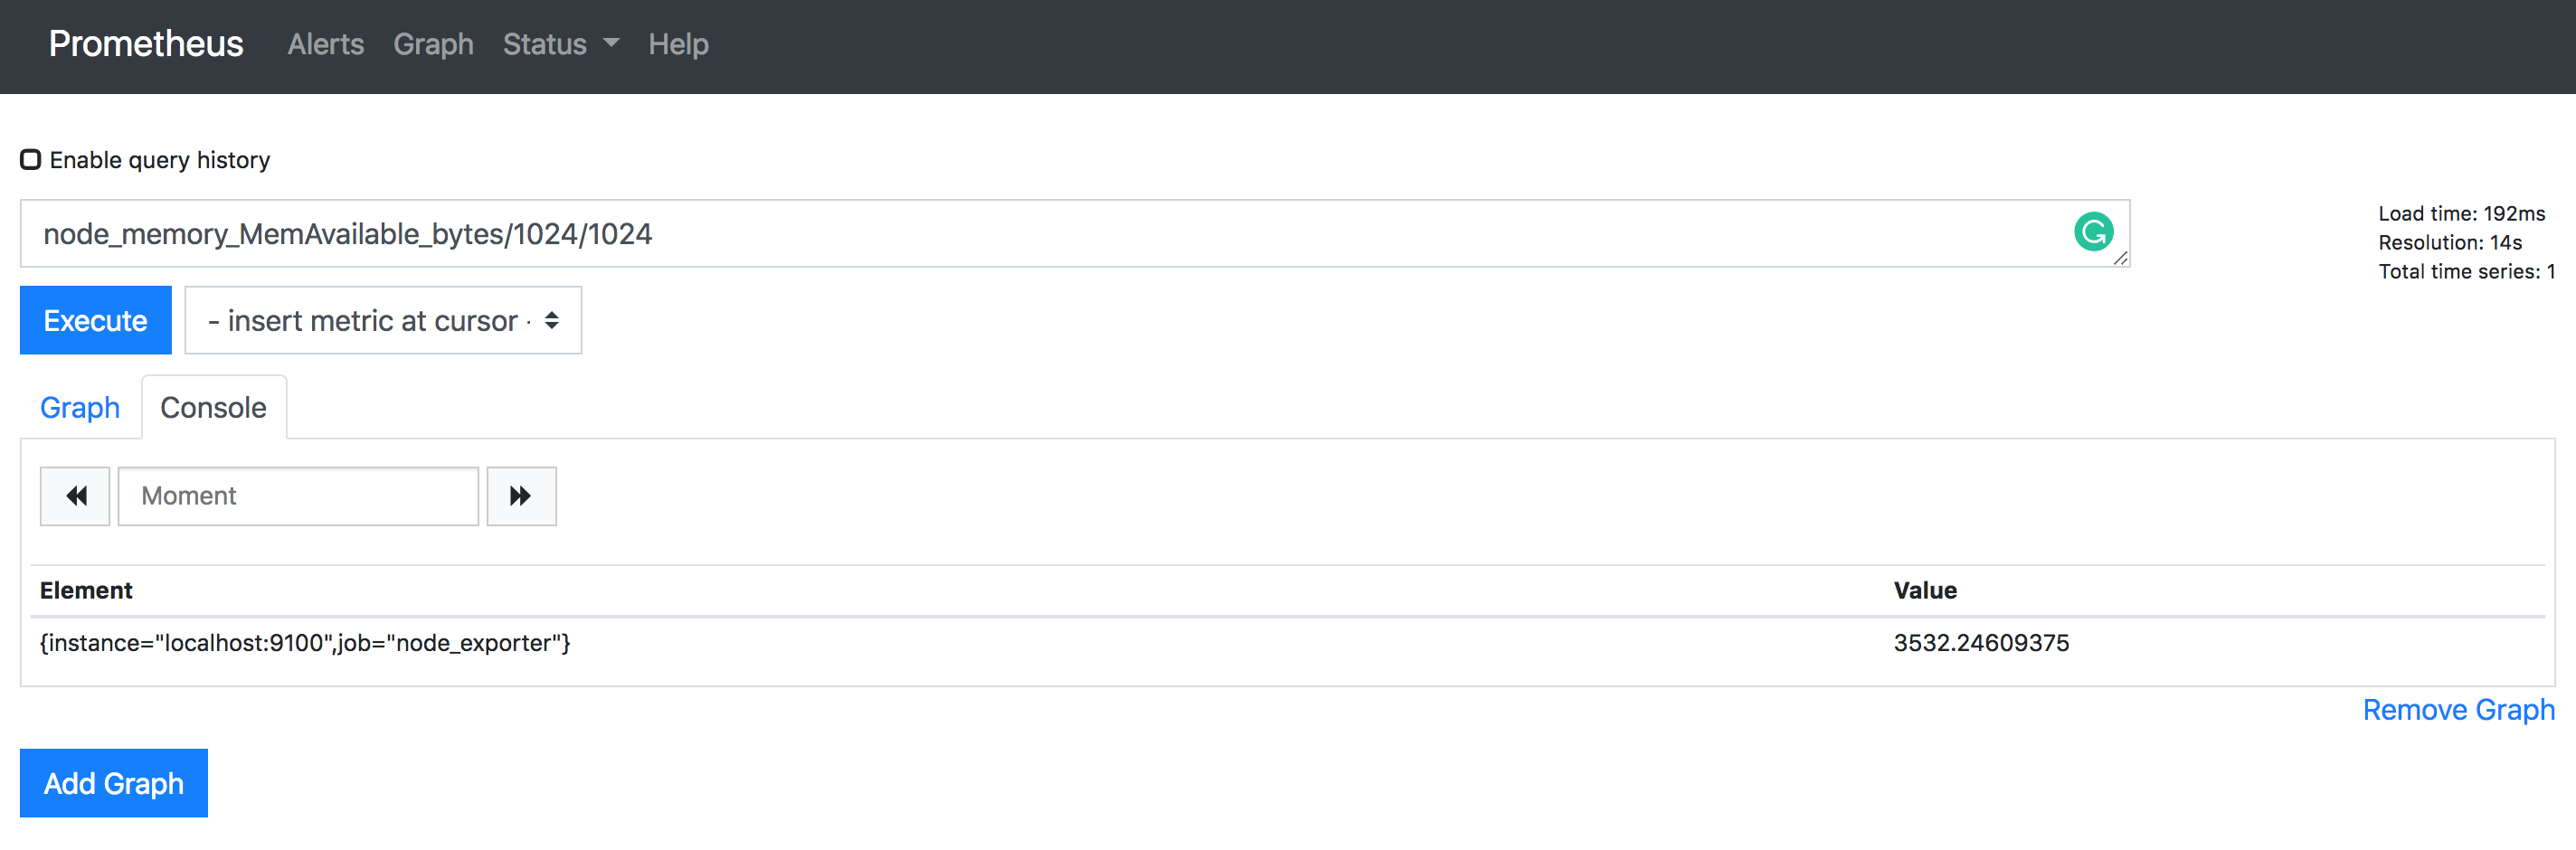
Now since the value is in bytes, let's convert the value to MB, (node_memory_MemAvailable_bytes/1024/1024)
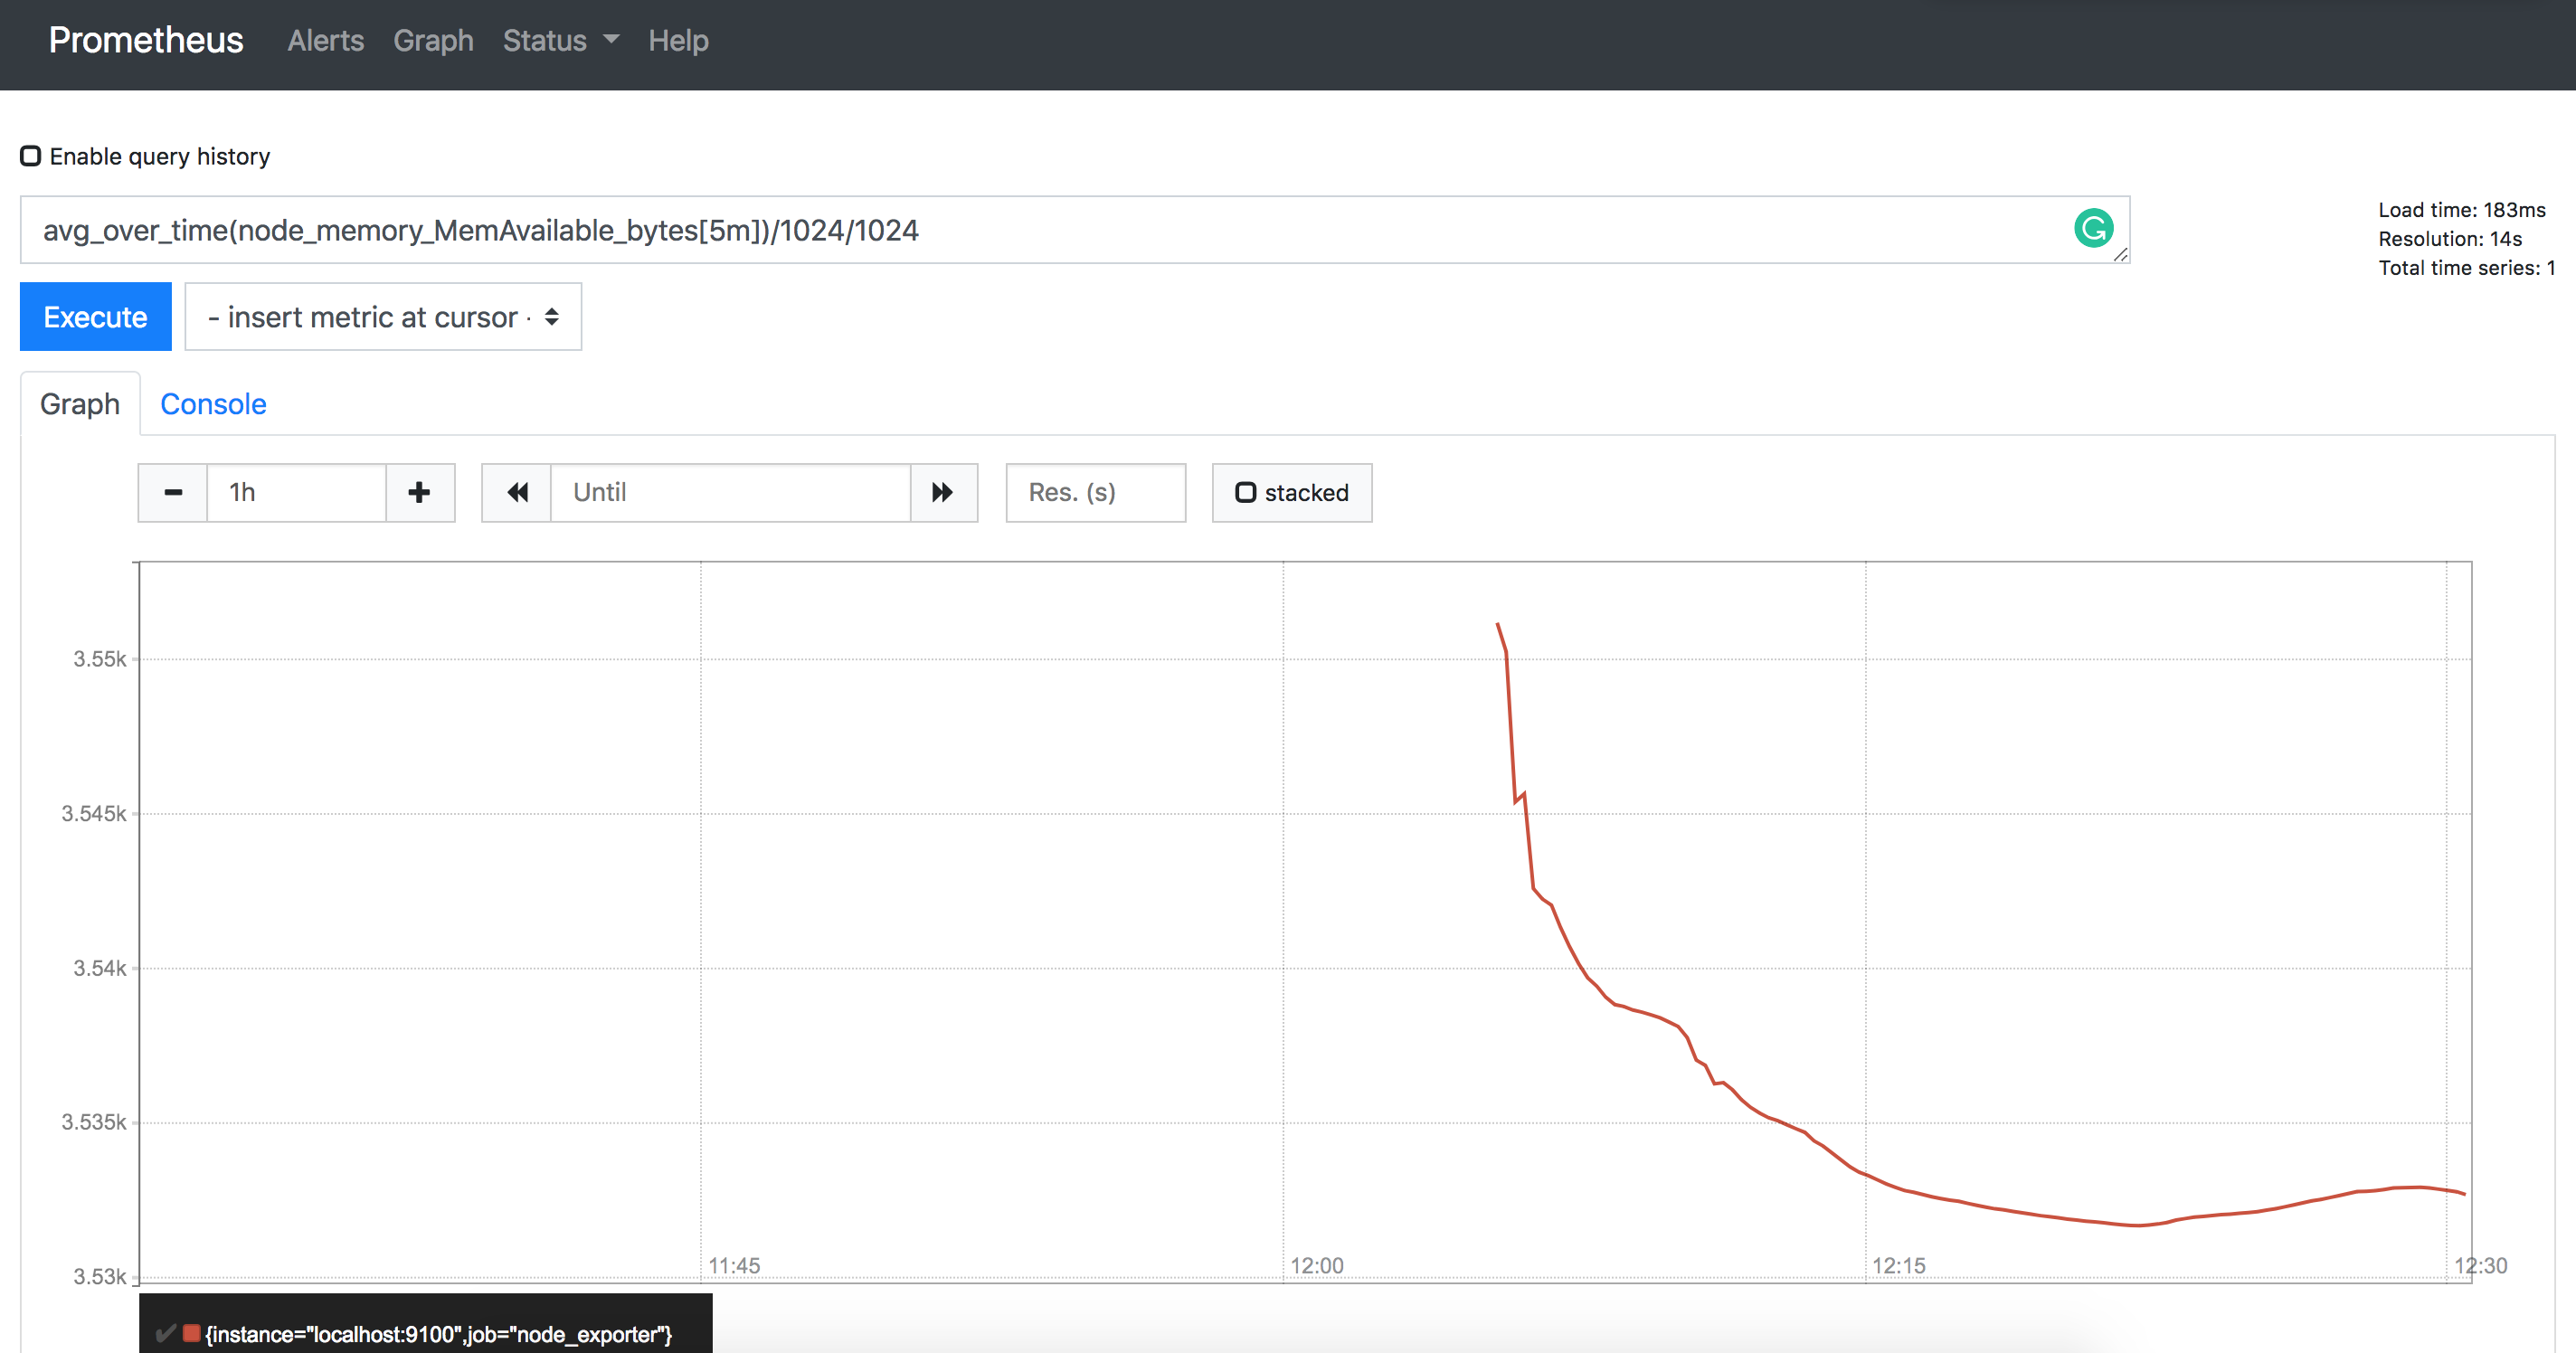
Let's say we want to see the average memory available in 5 minute buckets:
That's a few basic ones, but feel free to checkout my Prometheus Cheatsheet for other examples. I update them as I find more queries.
Thanks
Hope this was informative. I am planning to publish a post on visualizing prometheus data with Grafana (which is EPIC!) and installing Pushgateway for custom integrations.
Comments